
Dashboards
Overview
Dashboards are a powerful way for you to see how your users are interacting with and experiencing your app in aggregate over time. You can create different types of charts that make it easy to monitor new and existing parts of your app for errors, performance problems, and usability issues that can inhibit feature adoption and prevent users from converting.
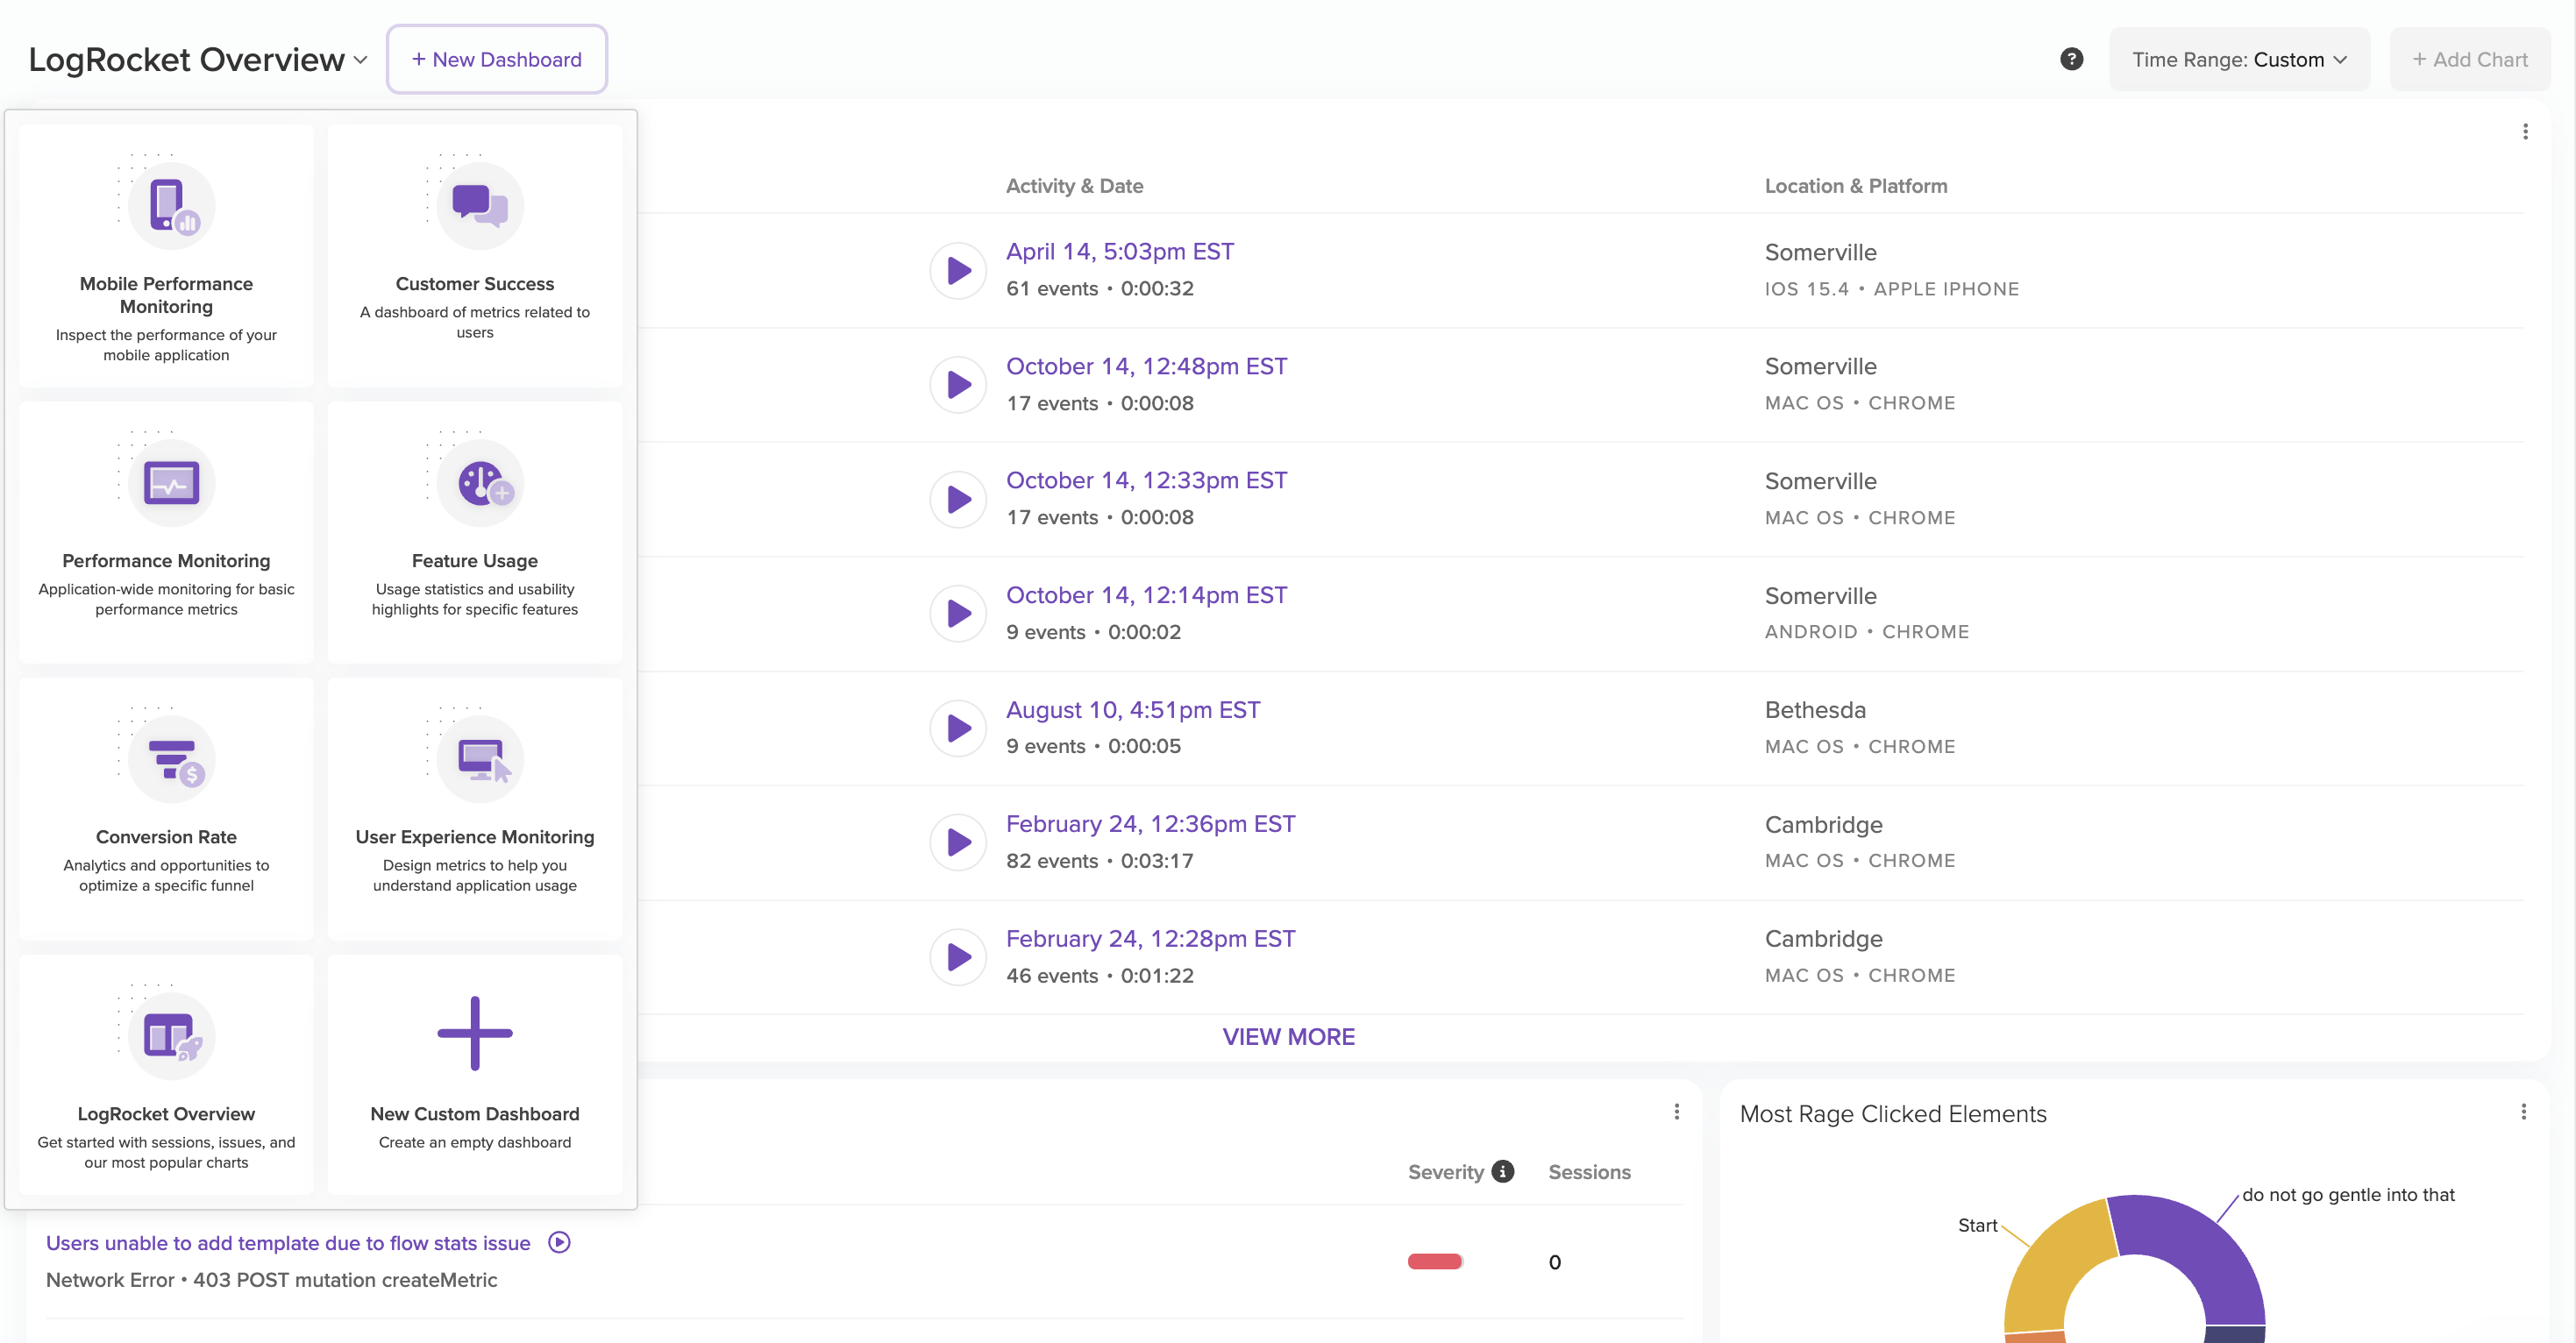
All users will start with our built-in LogRocket Overview dashboard which contains some of our most popular and useful charts. This is a special dashboard that cannot have custom charts added it to it and cannot be deleted.
Custom dashboards and charts are a feature provided as part of the LogRocket Professional Plan.
Creating a Custom Dashboard
You can create custom Dashboards that are collections of related charts by clicking the '+ New Dashboard' button next to the title. For example, you may choose to create a dashboard for a specific feature that you are interested in tracking and display relevant charts.
Using Dashboard Templates
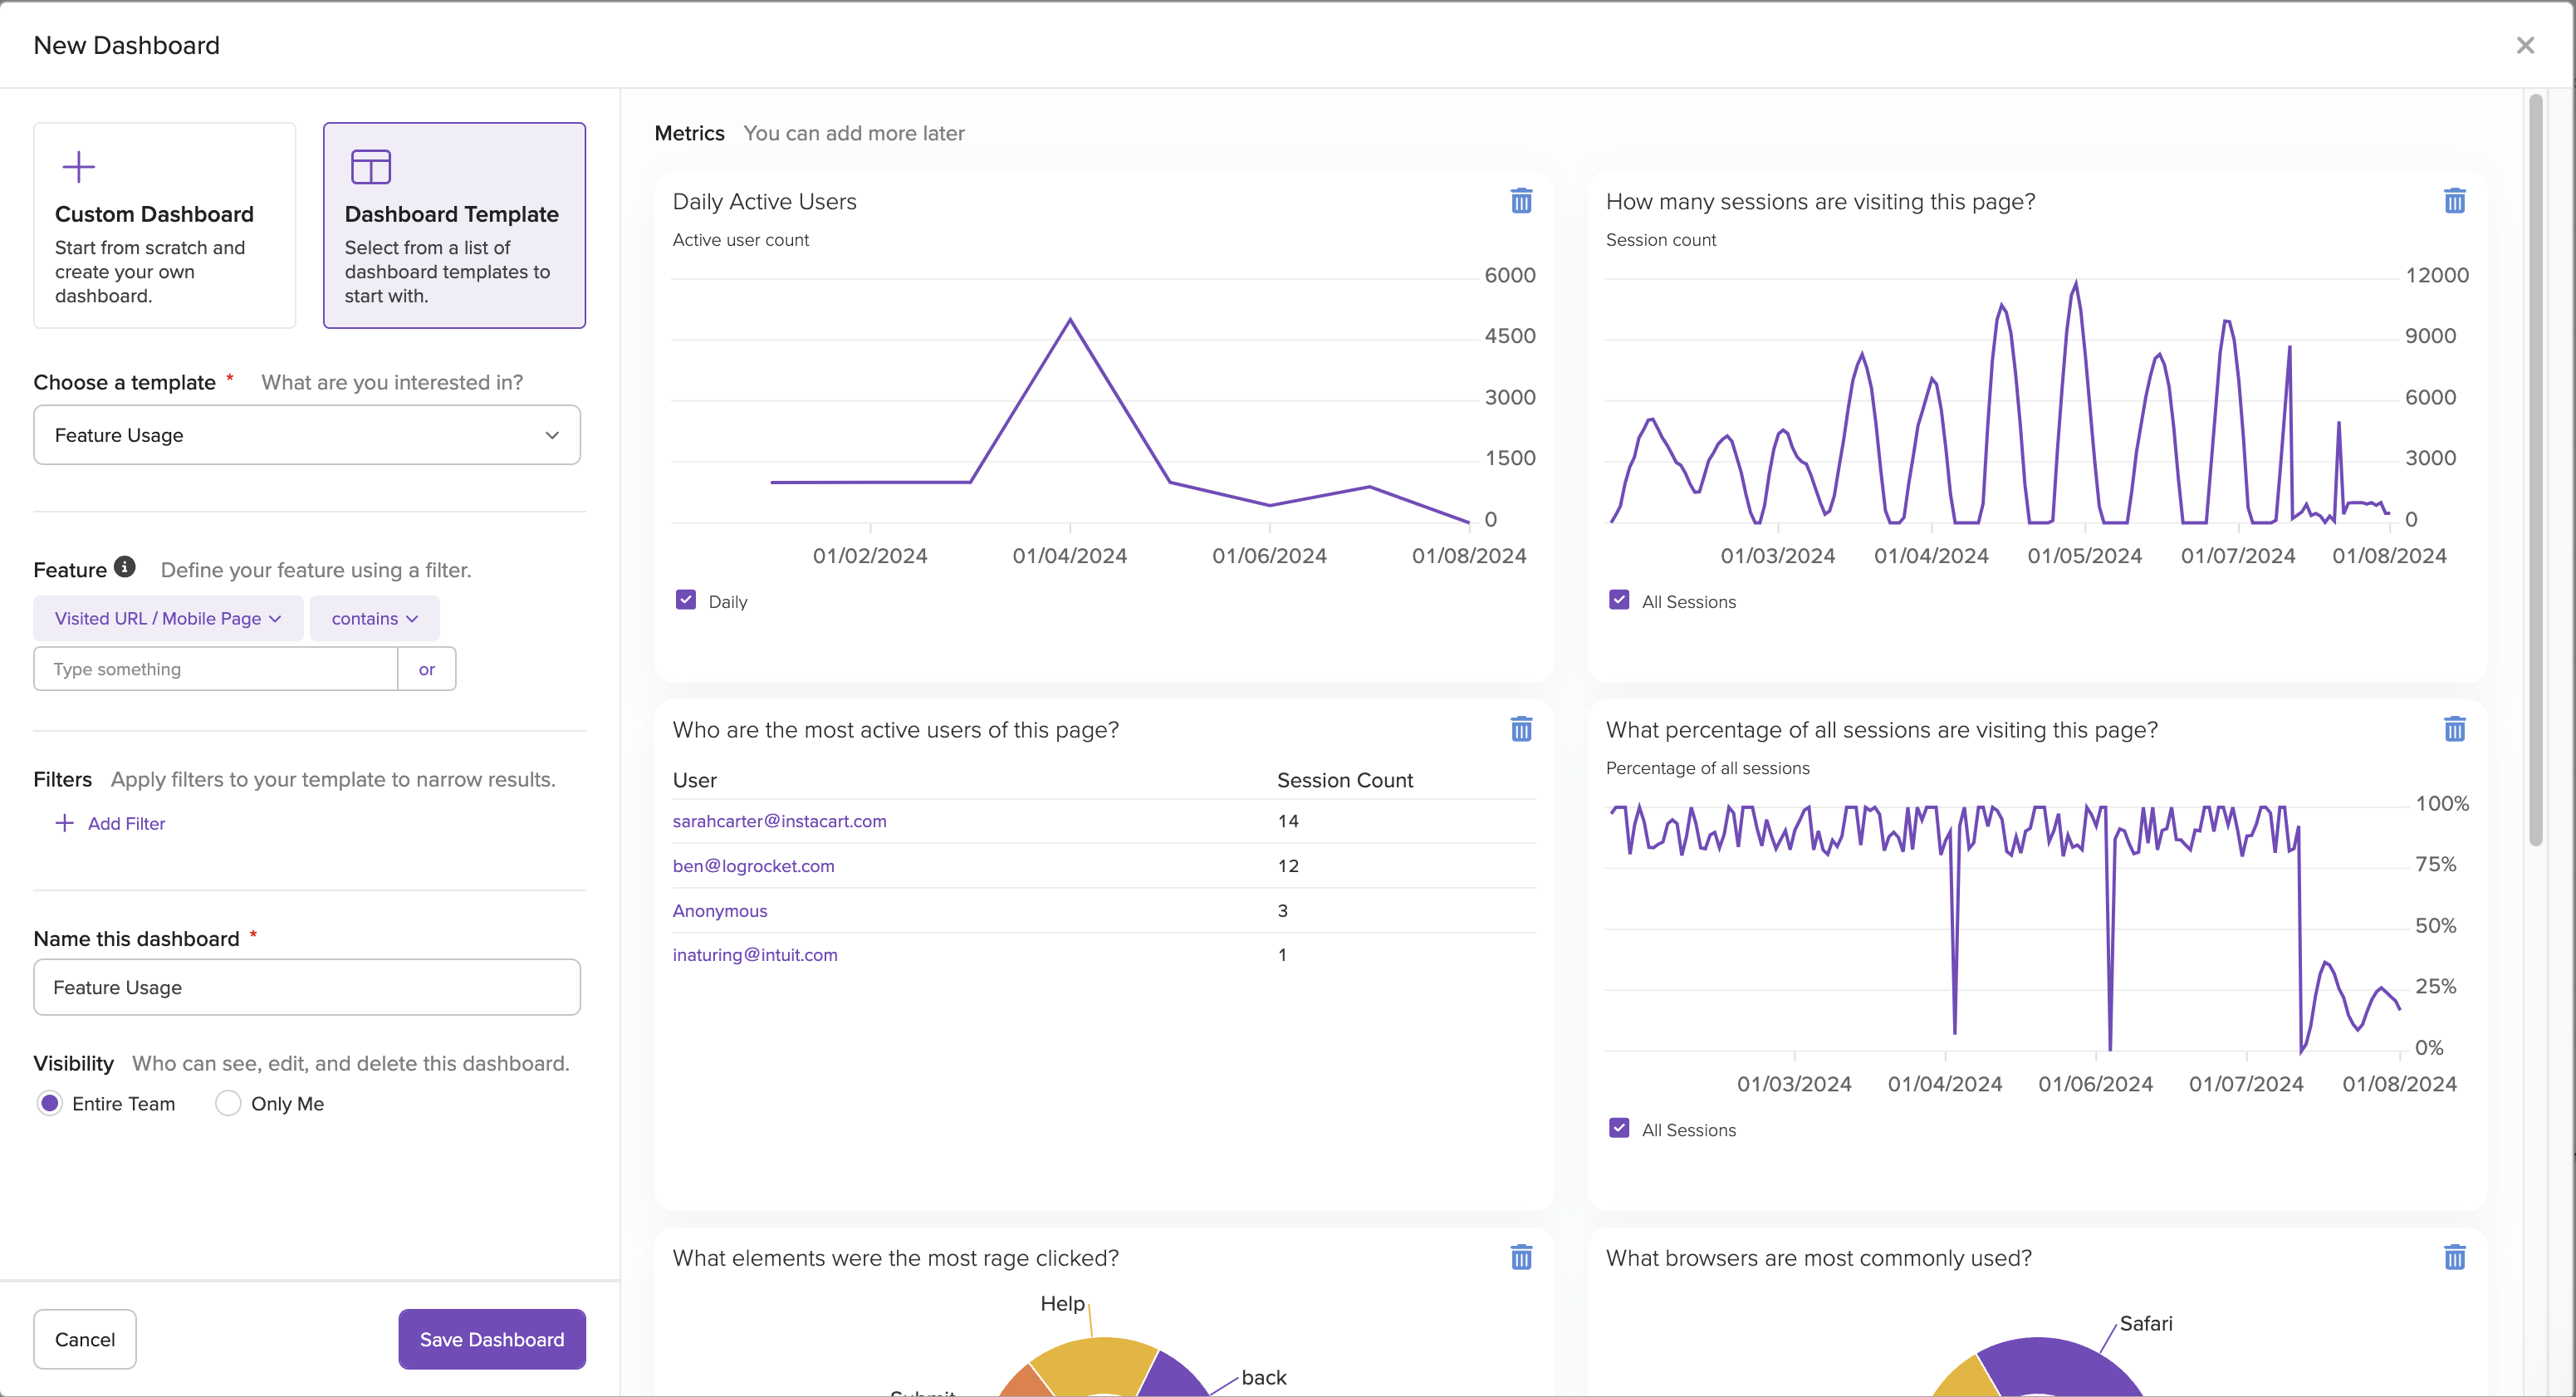
You can choose to get started with one of our Dashboard Templates, which come pre-filled with some suggested charts, or start with a custom blank dashboard which you can add charts to later.
Each template offers a different starting point for you to gain insights about your application and users without needing to manually create every chart. Most of the templates require no input, but the Feature Usage dashboard allows you to input a specific URL (or Definition) corresponding to a particular Feature you are interesting in getting more analytics on. If you choose to start with a template, you can edit or delete any of the charts provided and add additional charts to these dashboards as well.
Feature Usage dashboardThis dashboard includes an option for you to define a feature that you are interested in tracking. The selected filter (including Definitions will then be applied to all charts within the dashboard.
For example, if you are interested in user behavior within an Accounts section, you may want to apply the filter "Visited URL contains "/account"". You can create multiple Feature Usage dashboards for each feature that you want to track.
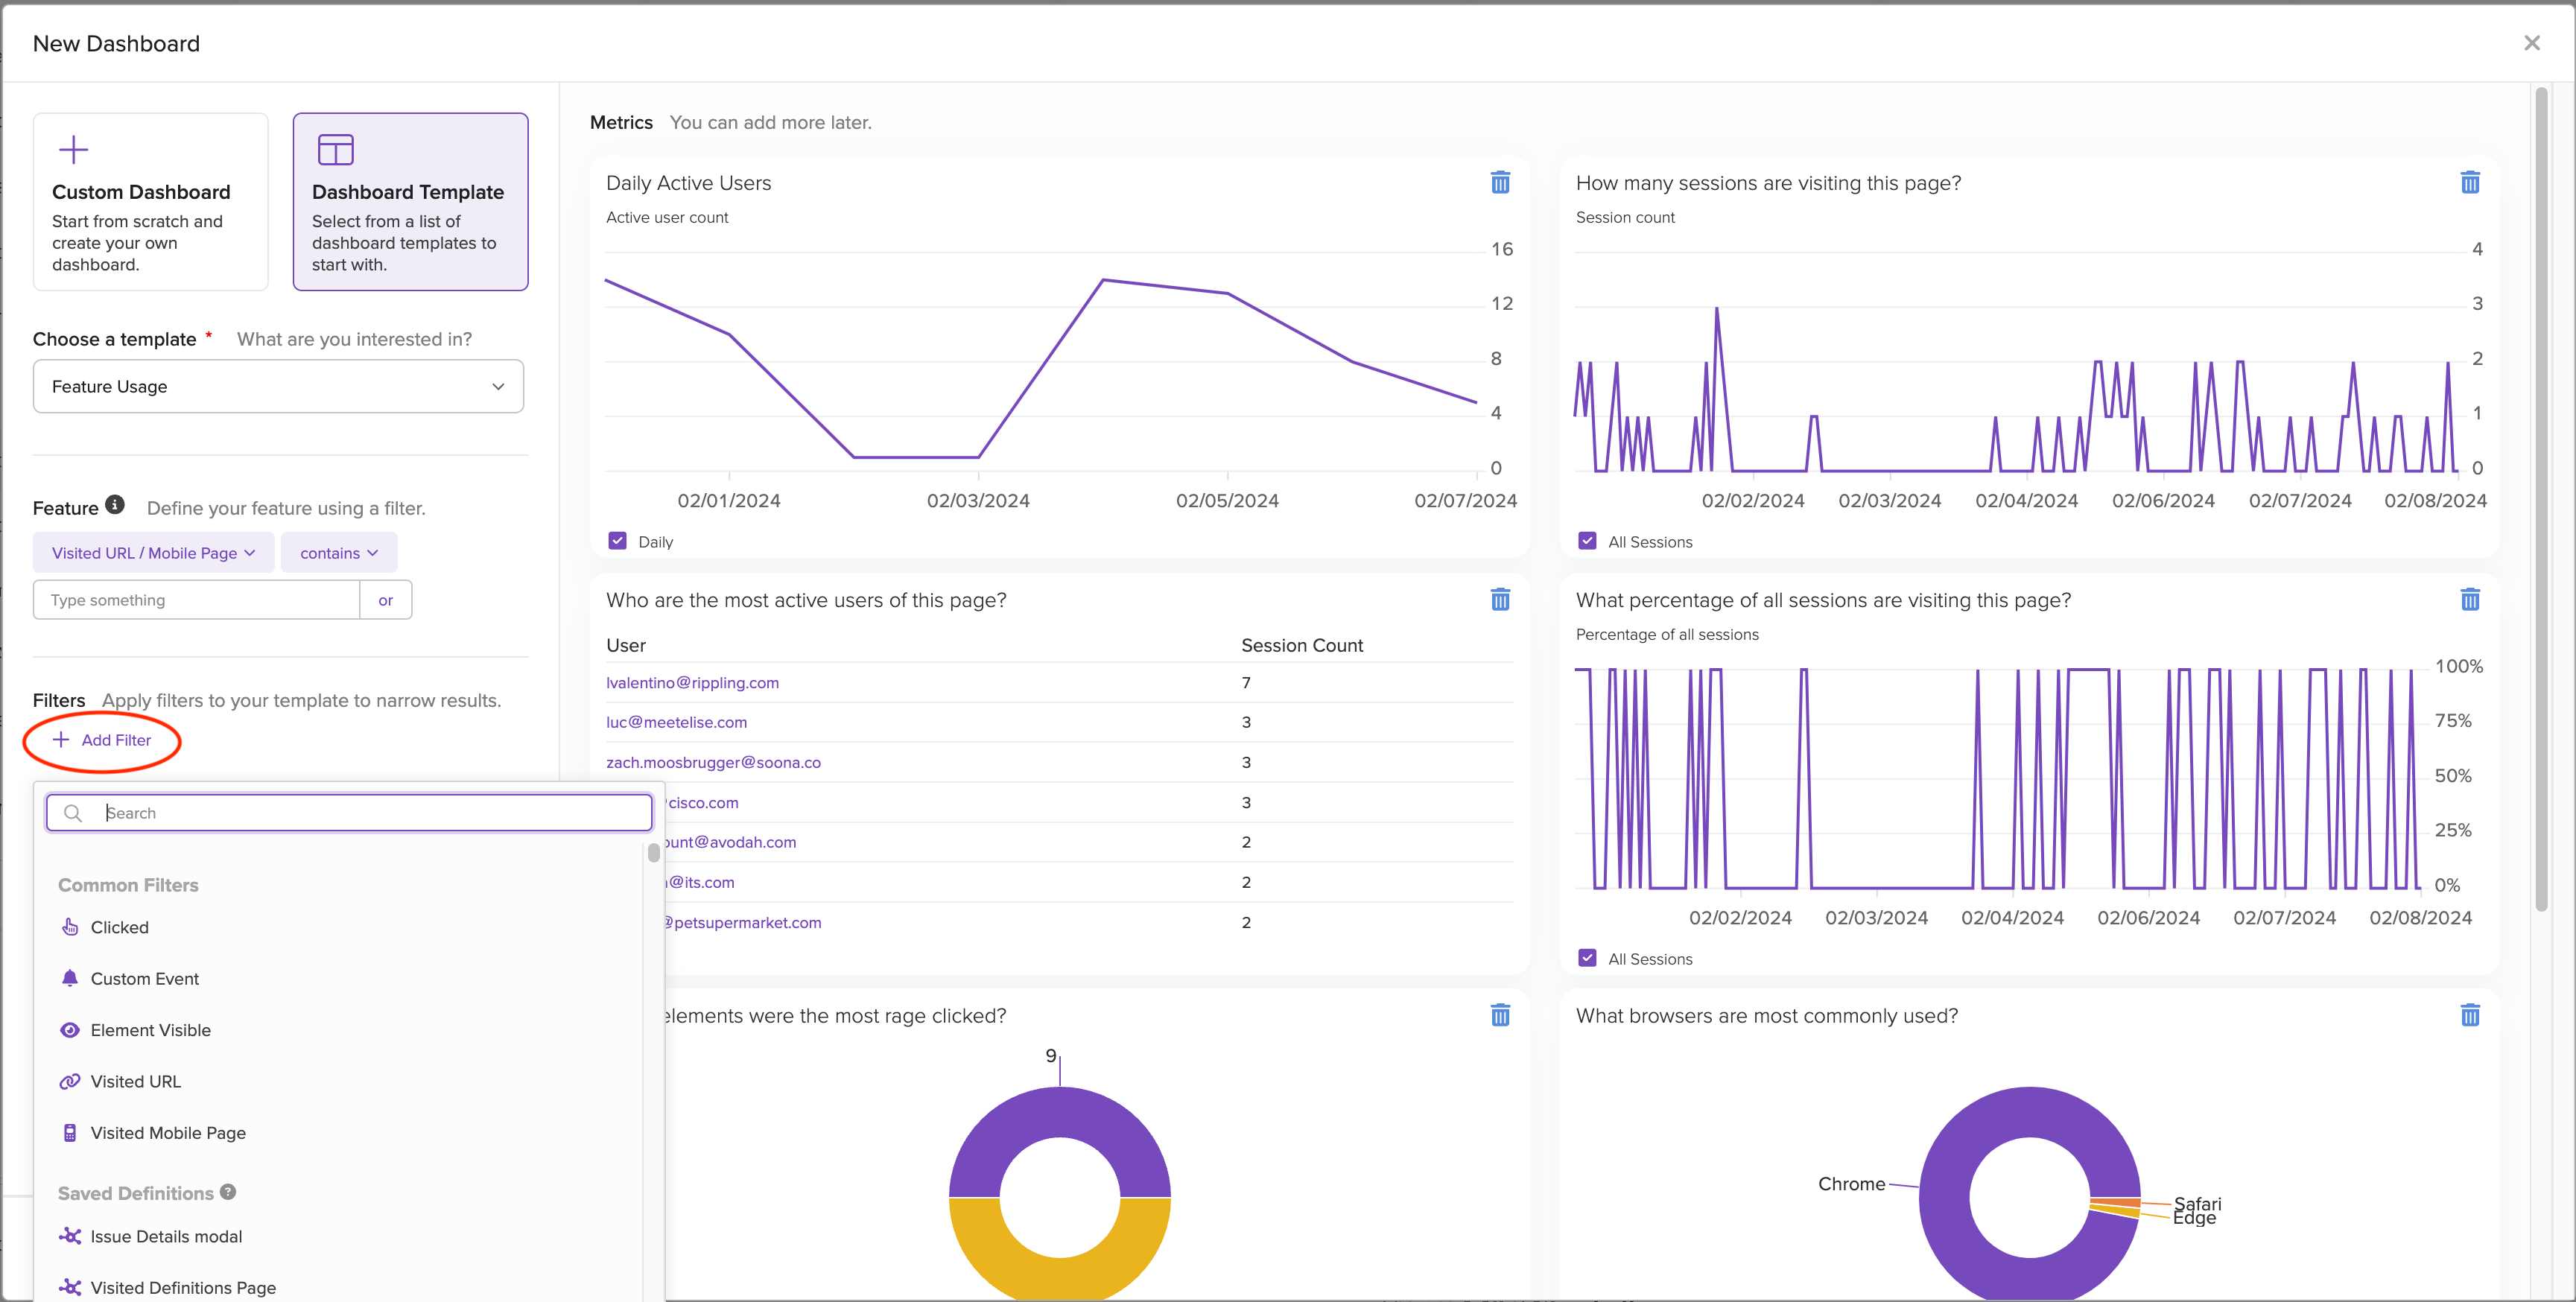
While creating a dashboard from a template, you can apply filters to all charts in the template to limit results based on session metadata (like browser, device, or SDK type) or to a particular user group (using email, country, etc.) To do this, click "+ Add Filter" in the builder on the lefthand side of the dashboard creation modal seen below.
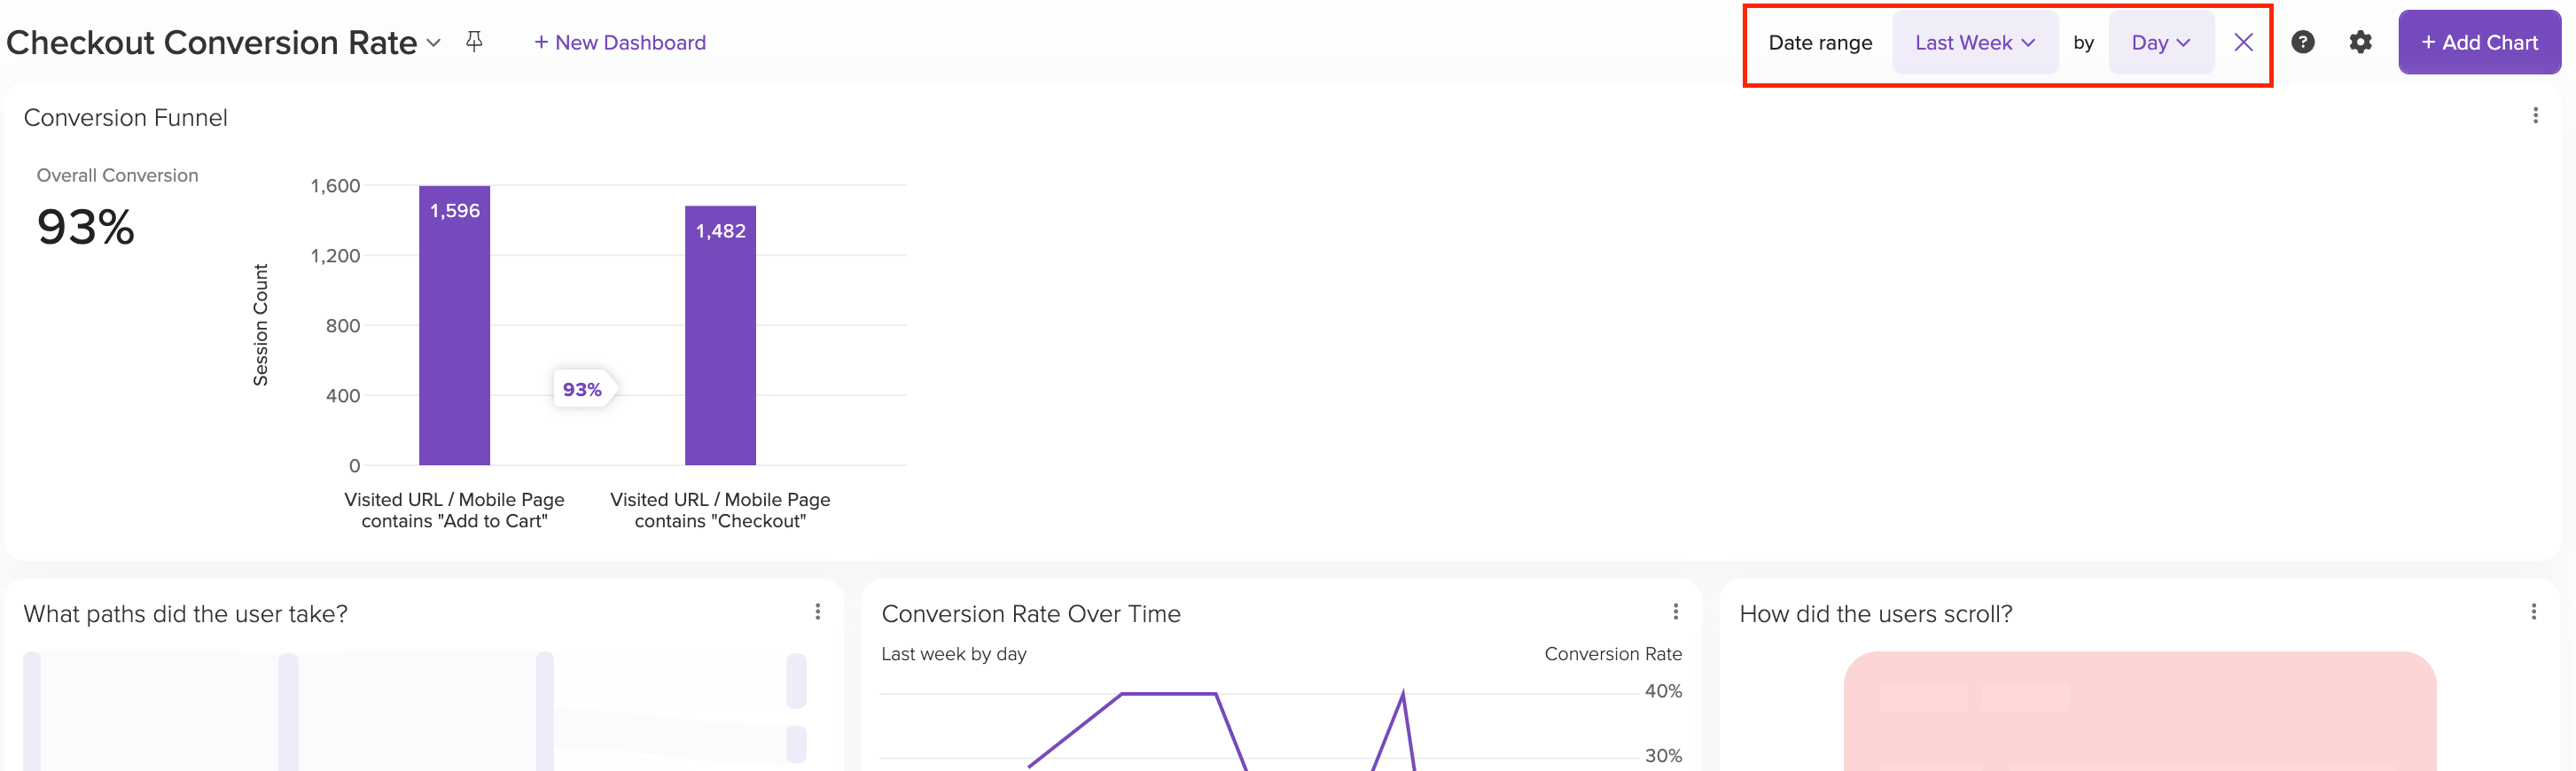
Filtering over Dashboards
Any LogRocket filter can be added to a dashboard using the omnibar at the top of the dashboard view. When filters are added, all metrics within the dashboard are updated to reflect those filters, giving you the power to analyze your data in a variety of ways.
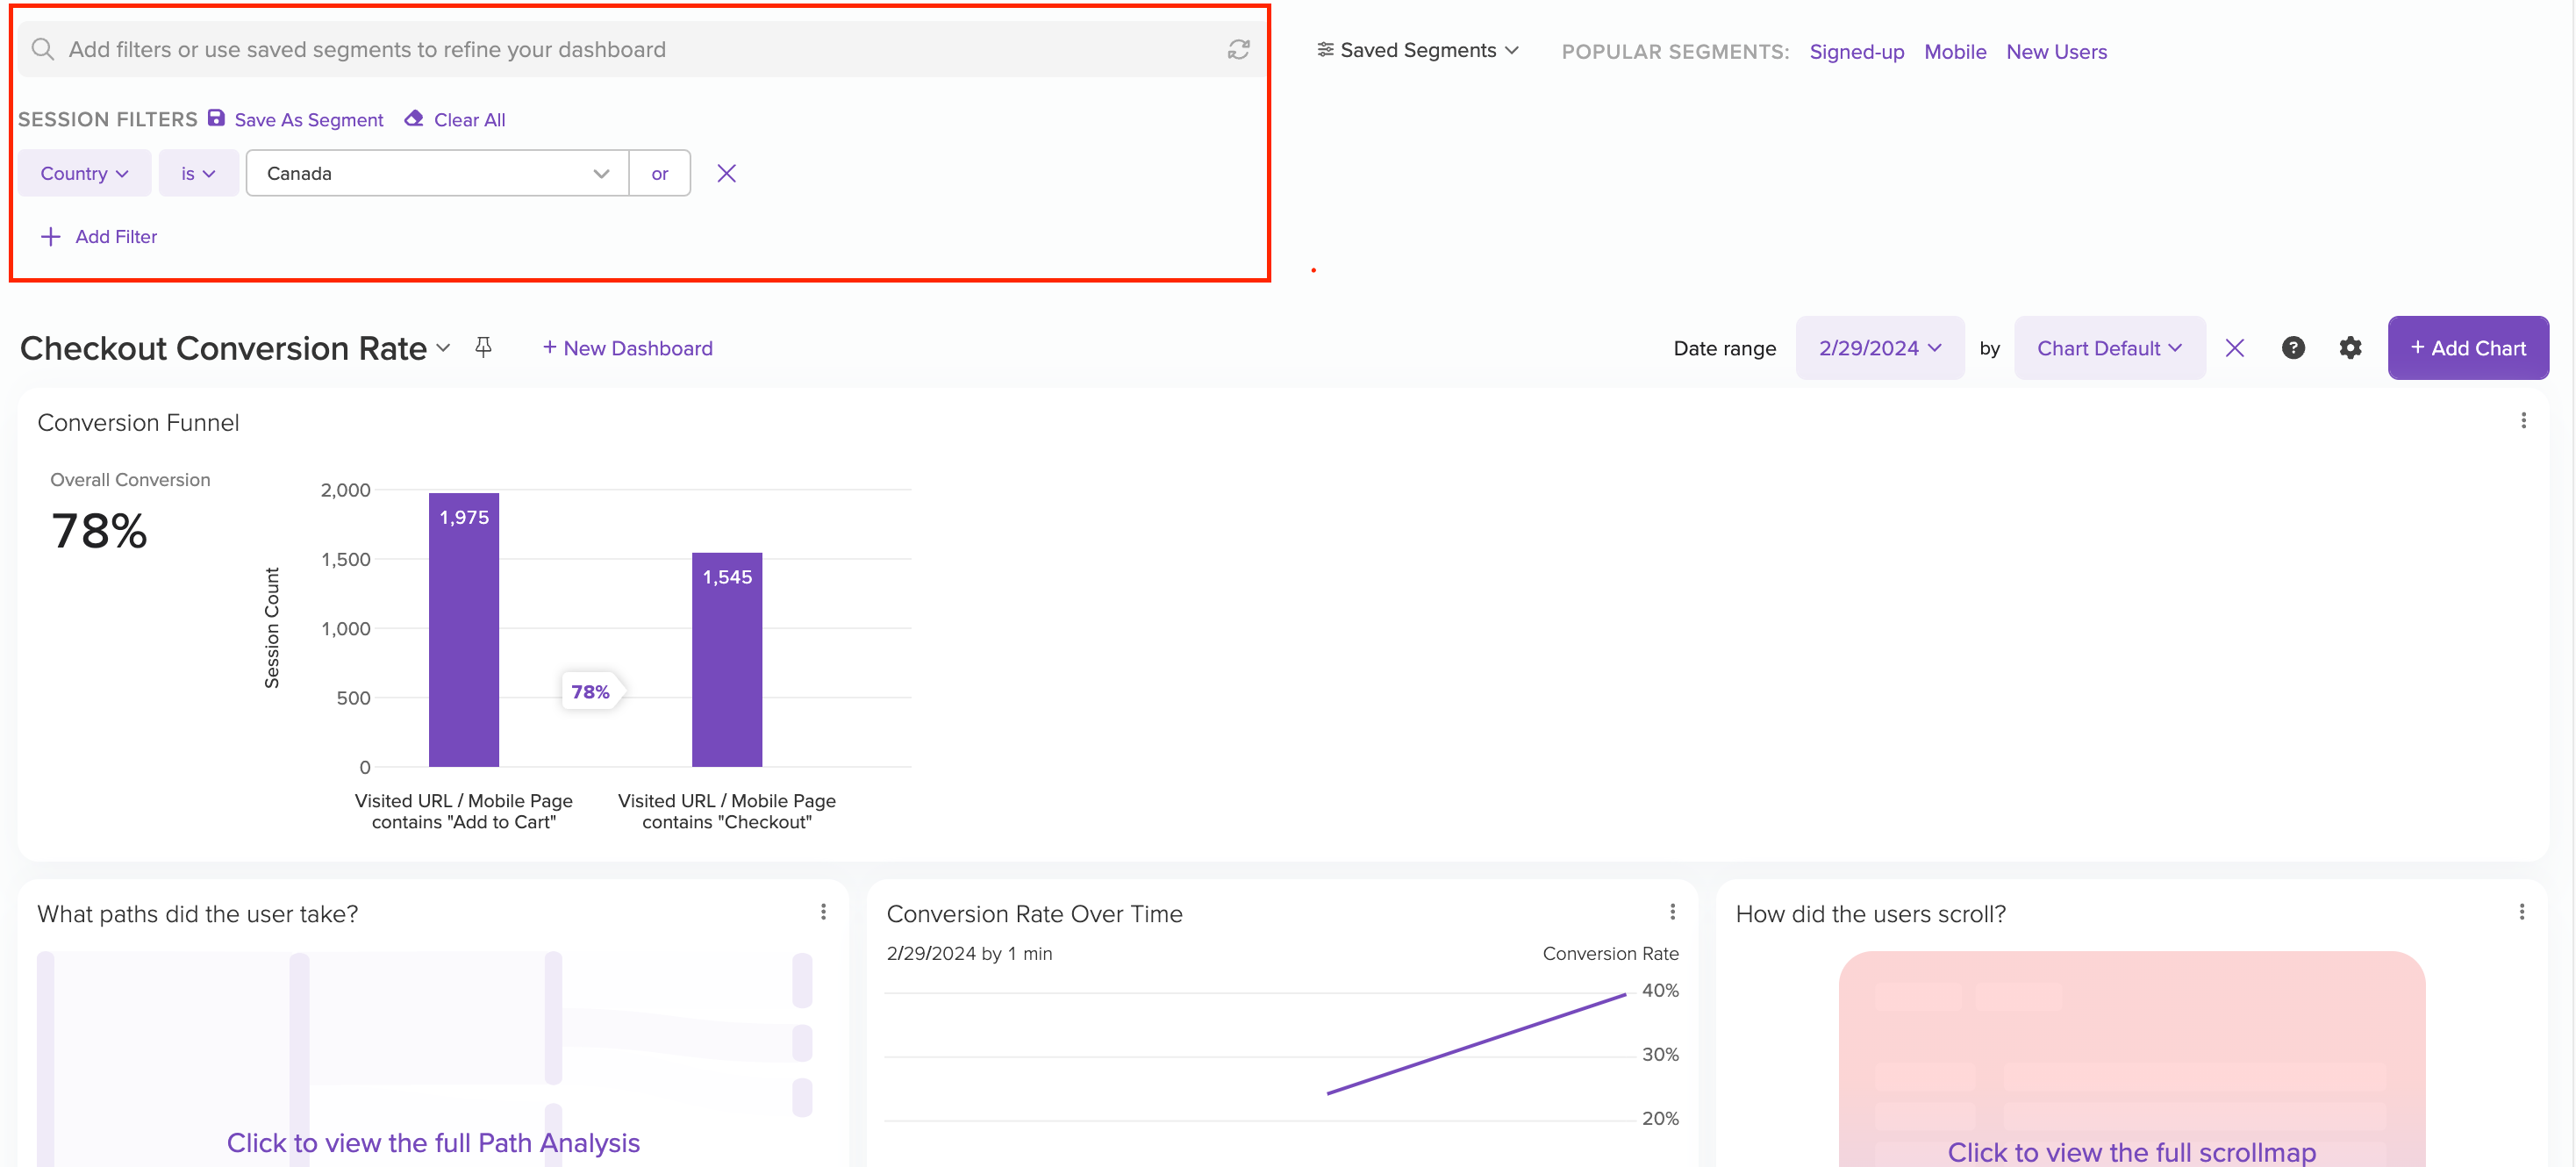
You can also filter a dashboard to a particular time range using the date range selector in the top right. This will apply a consistent time range and interval to all charts on the dashboard. To remove the time range and allow the charts to use their saved time ranges, simply click the "X" to the right of the interval picker.
Pinning dashboardsYou can choose to 'pin' a favorite dashboard by clicking the pin icon for the relevant dashboard in the dashboards list. This ensures that the selected dashboard will be the default one that appears whenever you click the 'Home' tab in the sidebar.
Adding Text to Dashboards
Text cards can be used to create sections on your dashboard or provide context on the metrics displayed. This is useful for helping others quickly get up to speed on what the dashboard is tracking and any other internal context you may want to share.
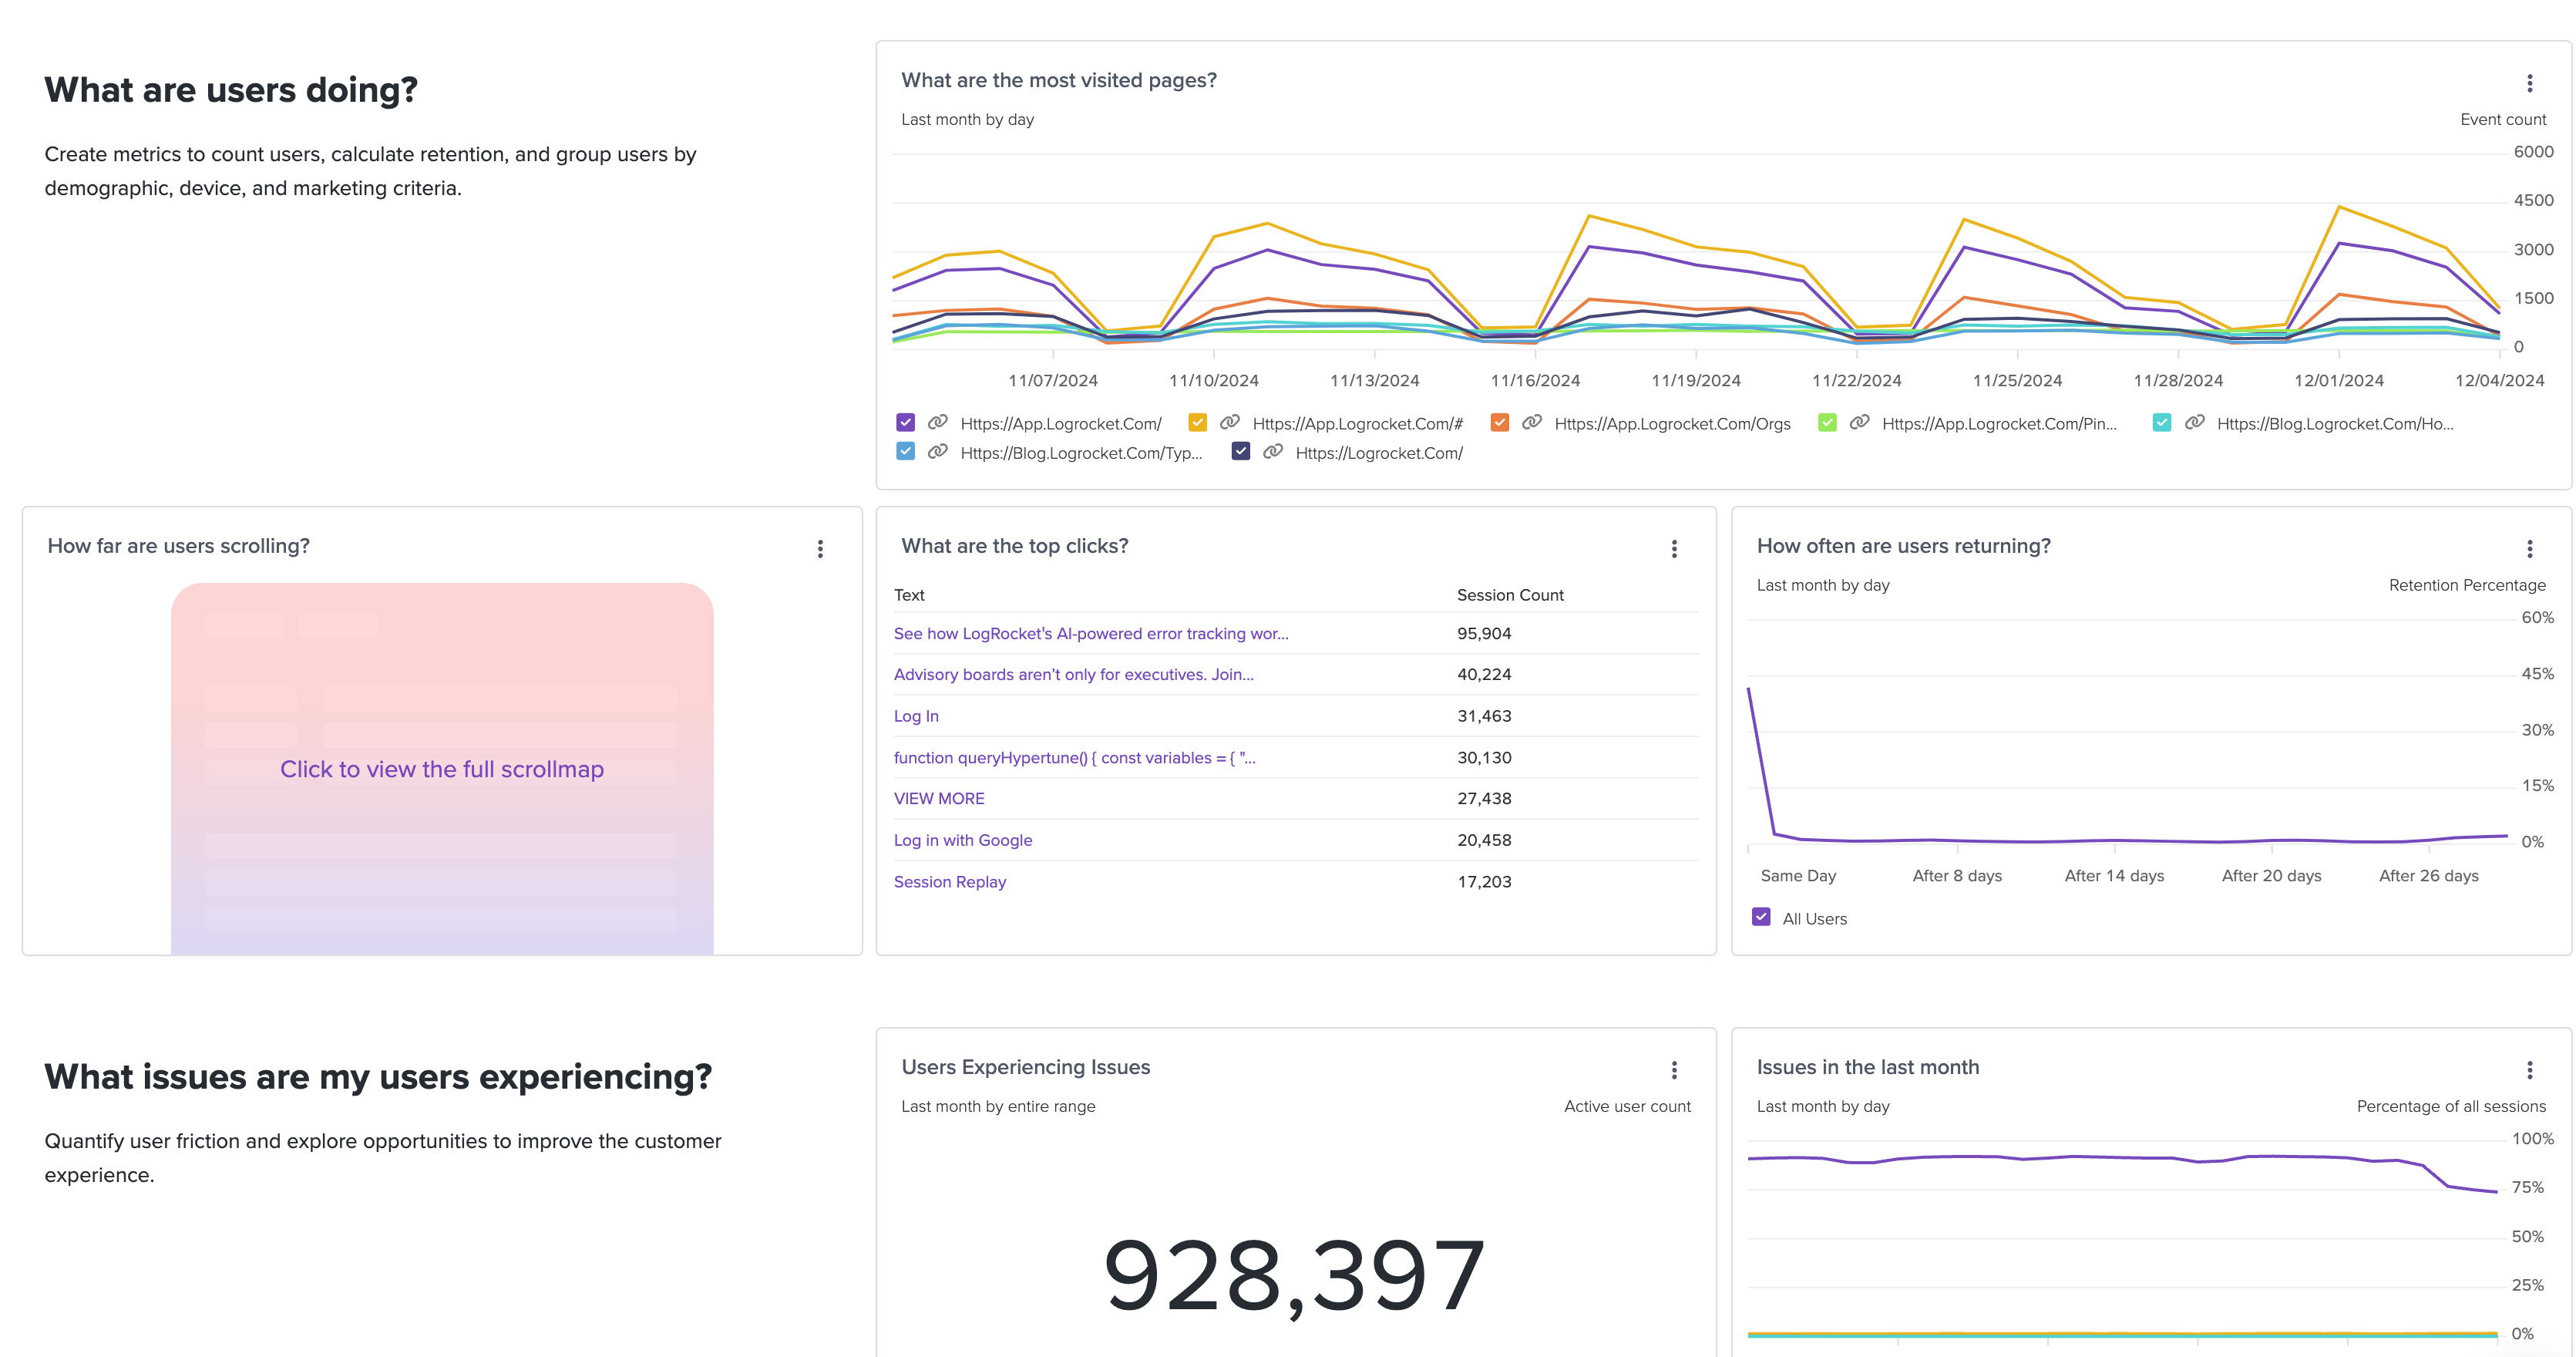
For example, our LogRocket Analytics Overview dashboard leverages the text cards to state the question each section of the dashboard is answering.
The title cards can also be used to easily create dashboard sections so that you can track multiple product features, UTM Campaigns, or Issues on the same dashboard.
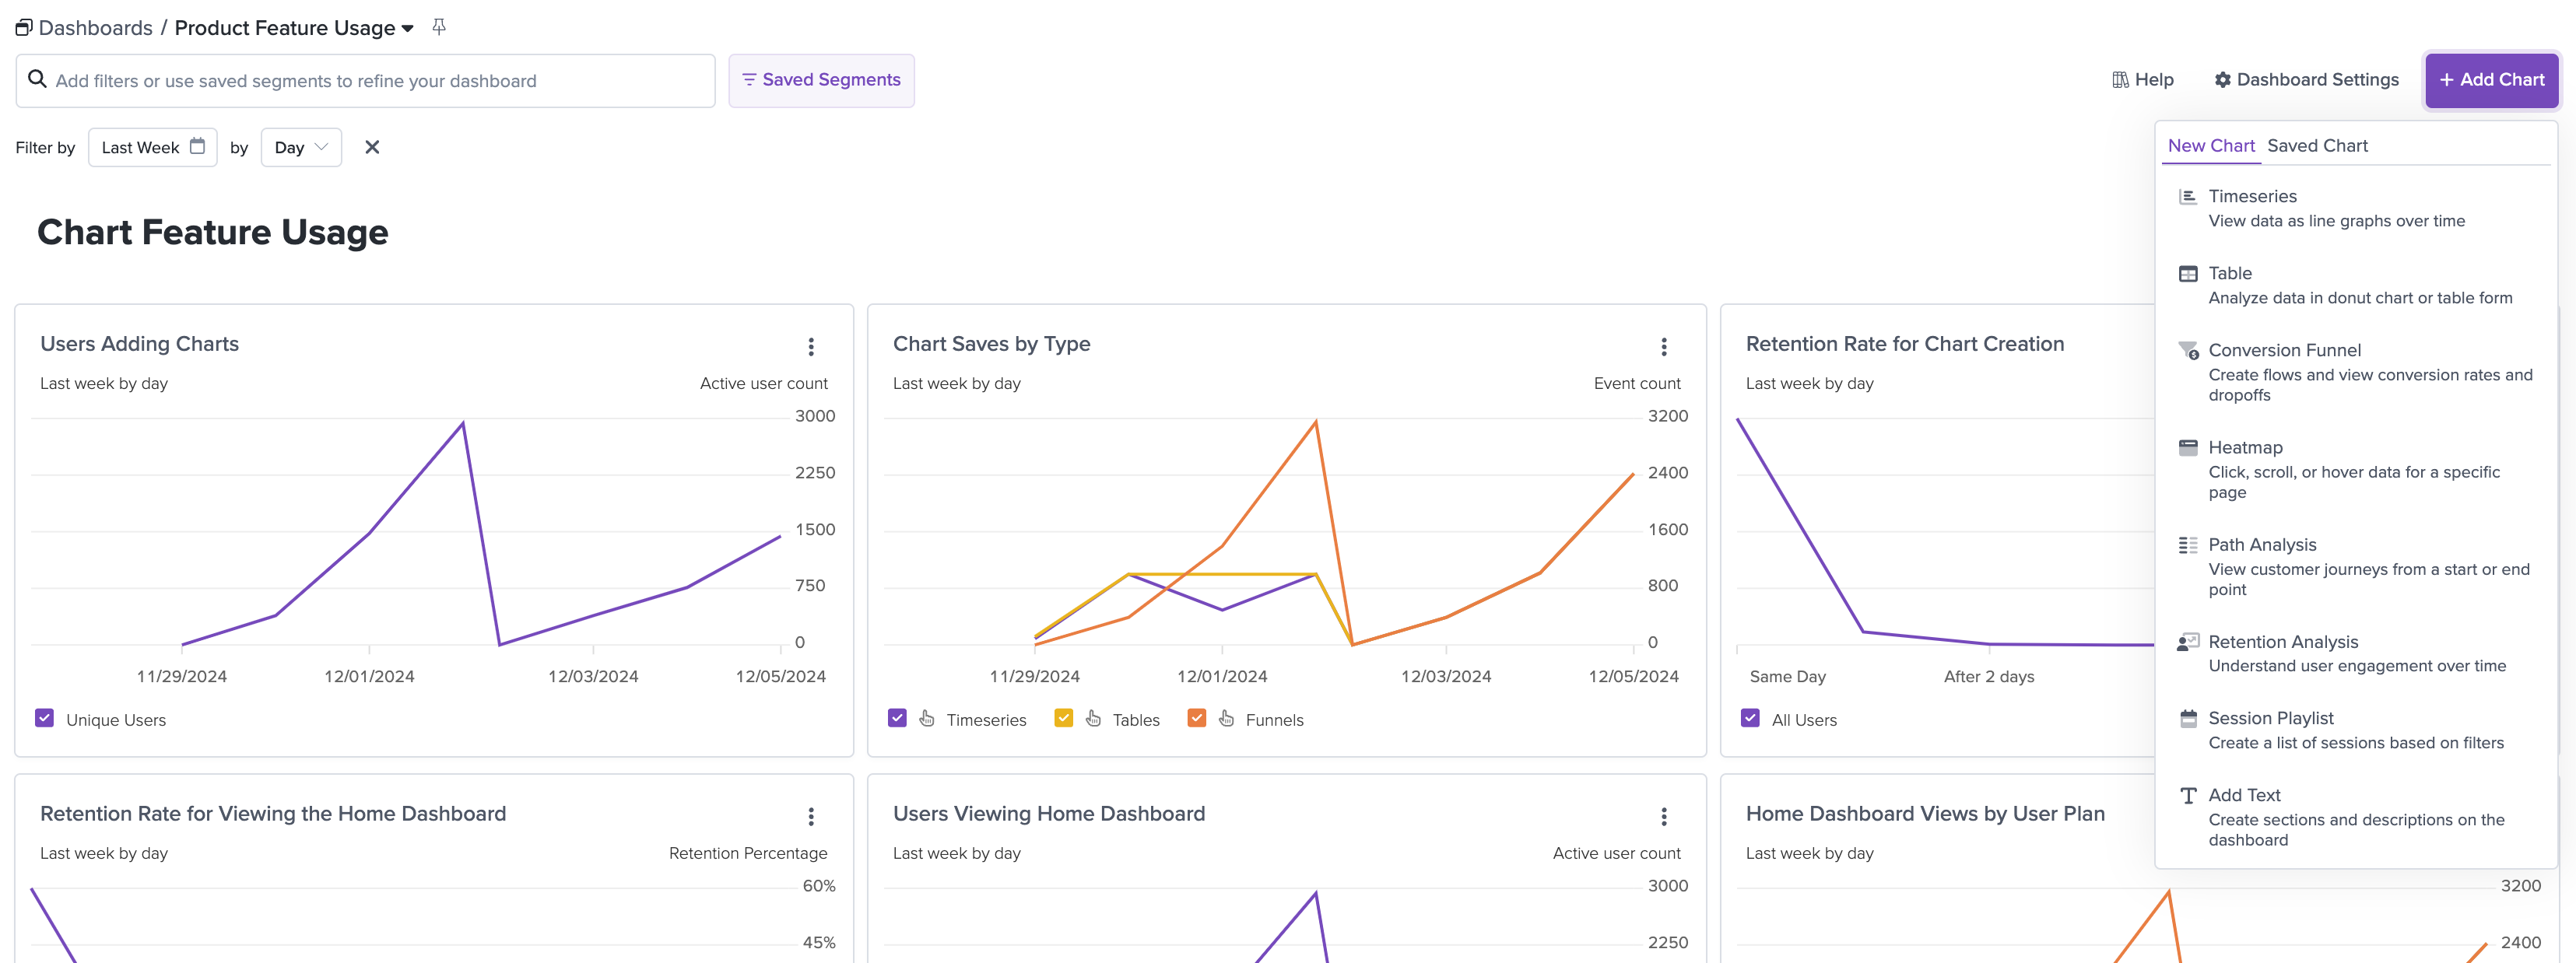
To add a text card to a dashboard, select the "Add Text" option from the "Add Chart" menu in the top right corner.
Charts
We support many different chart types, including Tables, Timeseries , Funnels, Heatmaps, and Path Analysis. You can see a list of the available chart types in different tabs along the lefthand navigation pane.
Chart list views
Each tab brings up a list of all personal (to you) and team-visible charts of that specific type across the application. You can also see which dashboards each chart is currently on.

From here, you can click on each chart to view or edit it, or click on the name of the Dashboard to be taken to the relevant Dashboard.
Metrics pagePlease note that the Metrics page includes charts of Table, Timeseries, and Session Playlist types!
Creating new charts
You can choose to create a new chart from either the tab (i.e. the Heatmaps tab to create a new heatmap) or from a Dashboard itself. To create a new chart, click the '+ Add Chart' button in the top right corner of any of these pages.
You will then see the Chart Edit and Detail view, where you can adjust the filters to create your chart. Below the chart for most chart types, you will see a list of the sessions relevant to a specific data point on the chart. For specifics, view the page for each individual chart type:
Each chart can be saved to have either Personal or Team visibility. This controls whether other team members can view the chart that you have created, and which type of Dashboard the chart can be added to.
Chart visibilityCharts that are created with Personal visibility can only be added to Personal dashboards, while charts that are created with Team visibility can only be added to Team dashboards.
Adding charts to dashboards
You can add an individual chart to one or more dashboards from either the individual chart view or the dashboard itself
Chart View
Click the 'Add to Dashboards' button in the top righthand corner of a chart. You will be able to toggle the visibility of the chart as well as see a list of existing Dashboards. To add the chart to a dashboard, click the name of the desired dashboard in the list. This will add the chart to the end of the selected dashboard.

Dashboard View
When you click 'Add Chart' in the top righthand corner of any Dashboard, you will see the option to either create a brand new chart of any type or select from a list of existing saved charts.

Clicking a chart name in the list will add the chart to the end of the dashboard (noted by a check next to the chart name). Clicking the chart name again will remove the chart from the dashboard.
Chart updatesWhen you have a chart that appears on multiple dashboards, persisting any changes to the chart will update the chart across all dashboards that it appears on.
Please note there is a limit of 25 charts per dashboard, but no limit to the number of dashboards you can have.
Updated 5 months ago