

Mobile Performance Dashboard
Users expect apps to operate quickly and efficiently. When apps are slow to launch or use, crash, or increase user’s data charges, they risk frustrating users and causing them to uninstall the app. Poor app performance may also cause play stores to demote an app in their search results . Monitoring key performance metrics ensures you are keeping existing users engaged and satisfied, and keeping a healthy pipeline open to new users.
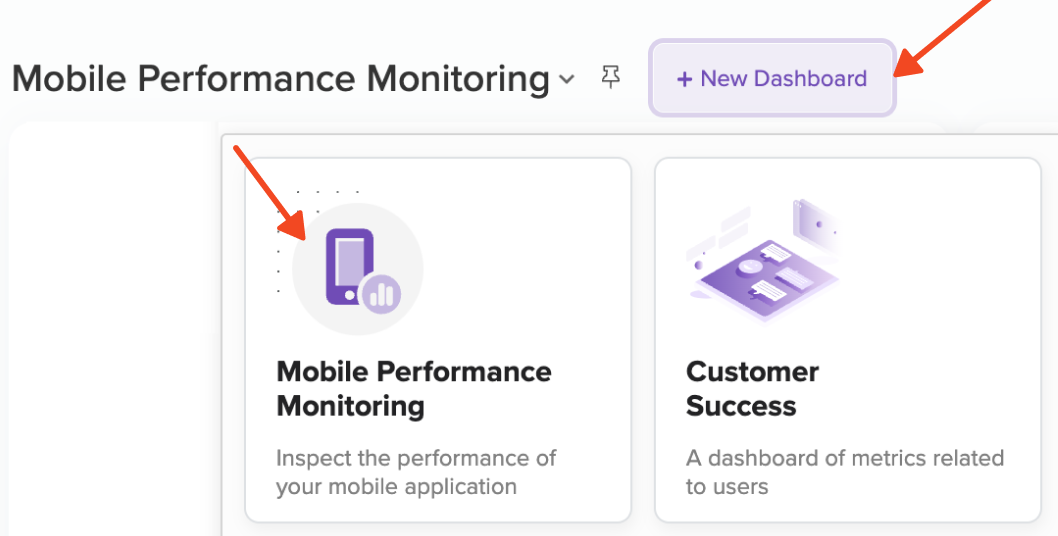
To get started with the Mobile Performance Monitoring Dashboard, click New Dashboard and select Mobile Performance Monitoring. Like all Dashboards, all metrics are fully customizable.
Technical Performance Metrics
App Start Time
A quick and responsive app launch time is a positive first experience for users of your app, and users have exacting standards. According to a Google study, 53% of users will quit an app if a page takes longer than 3 seconds to load.
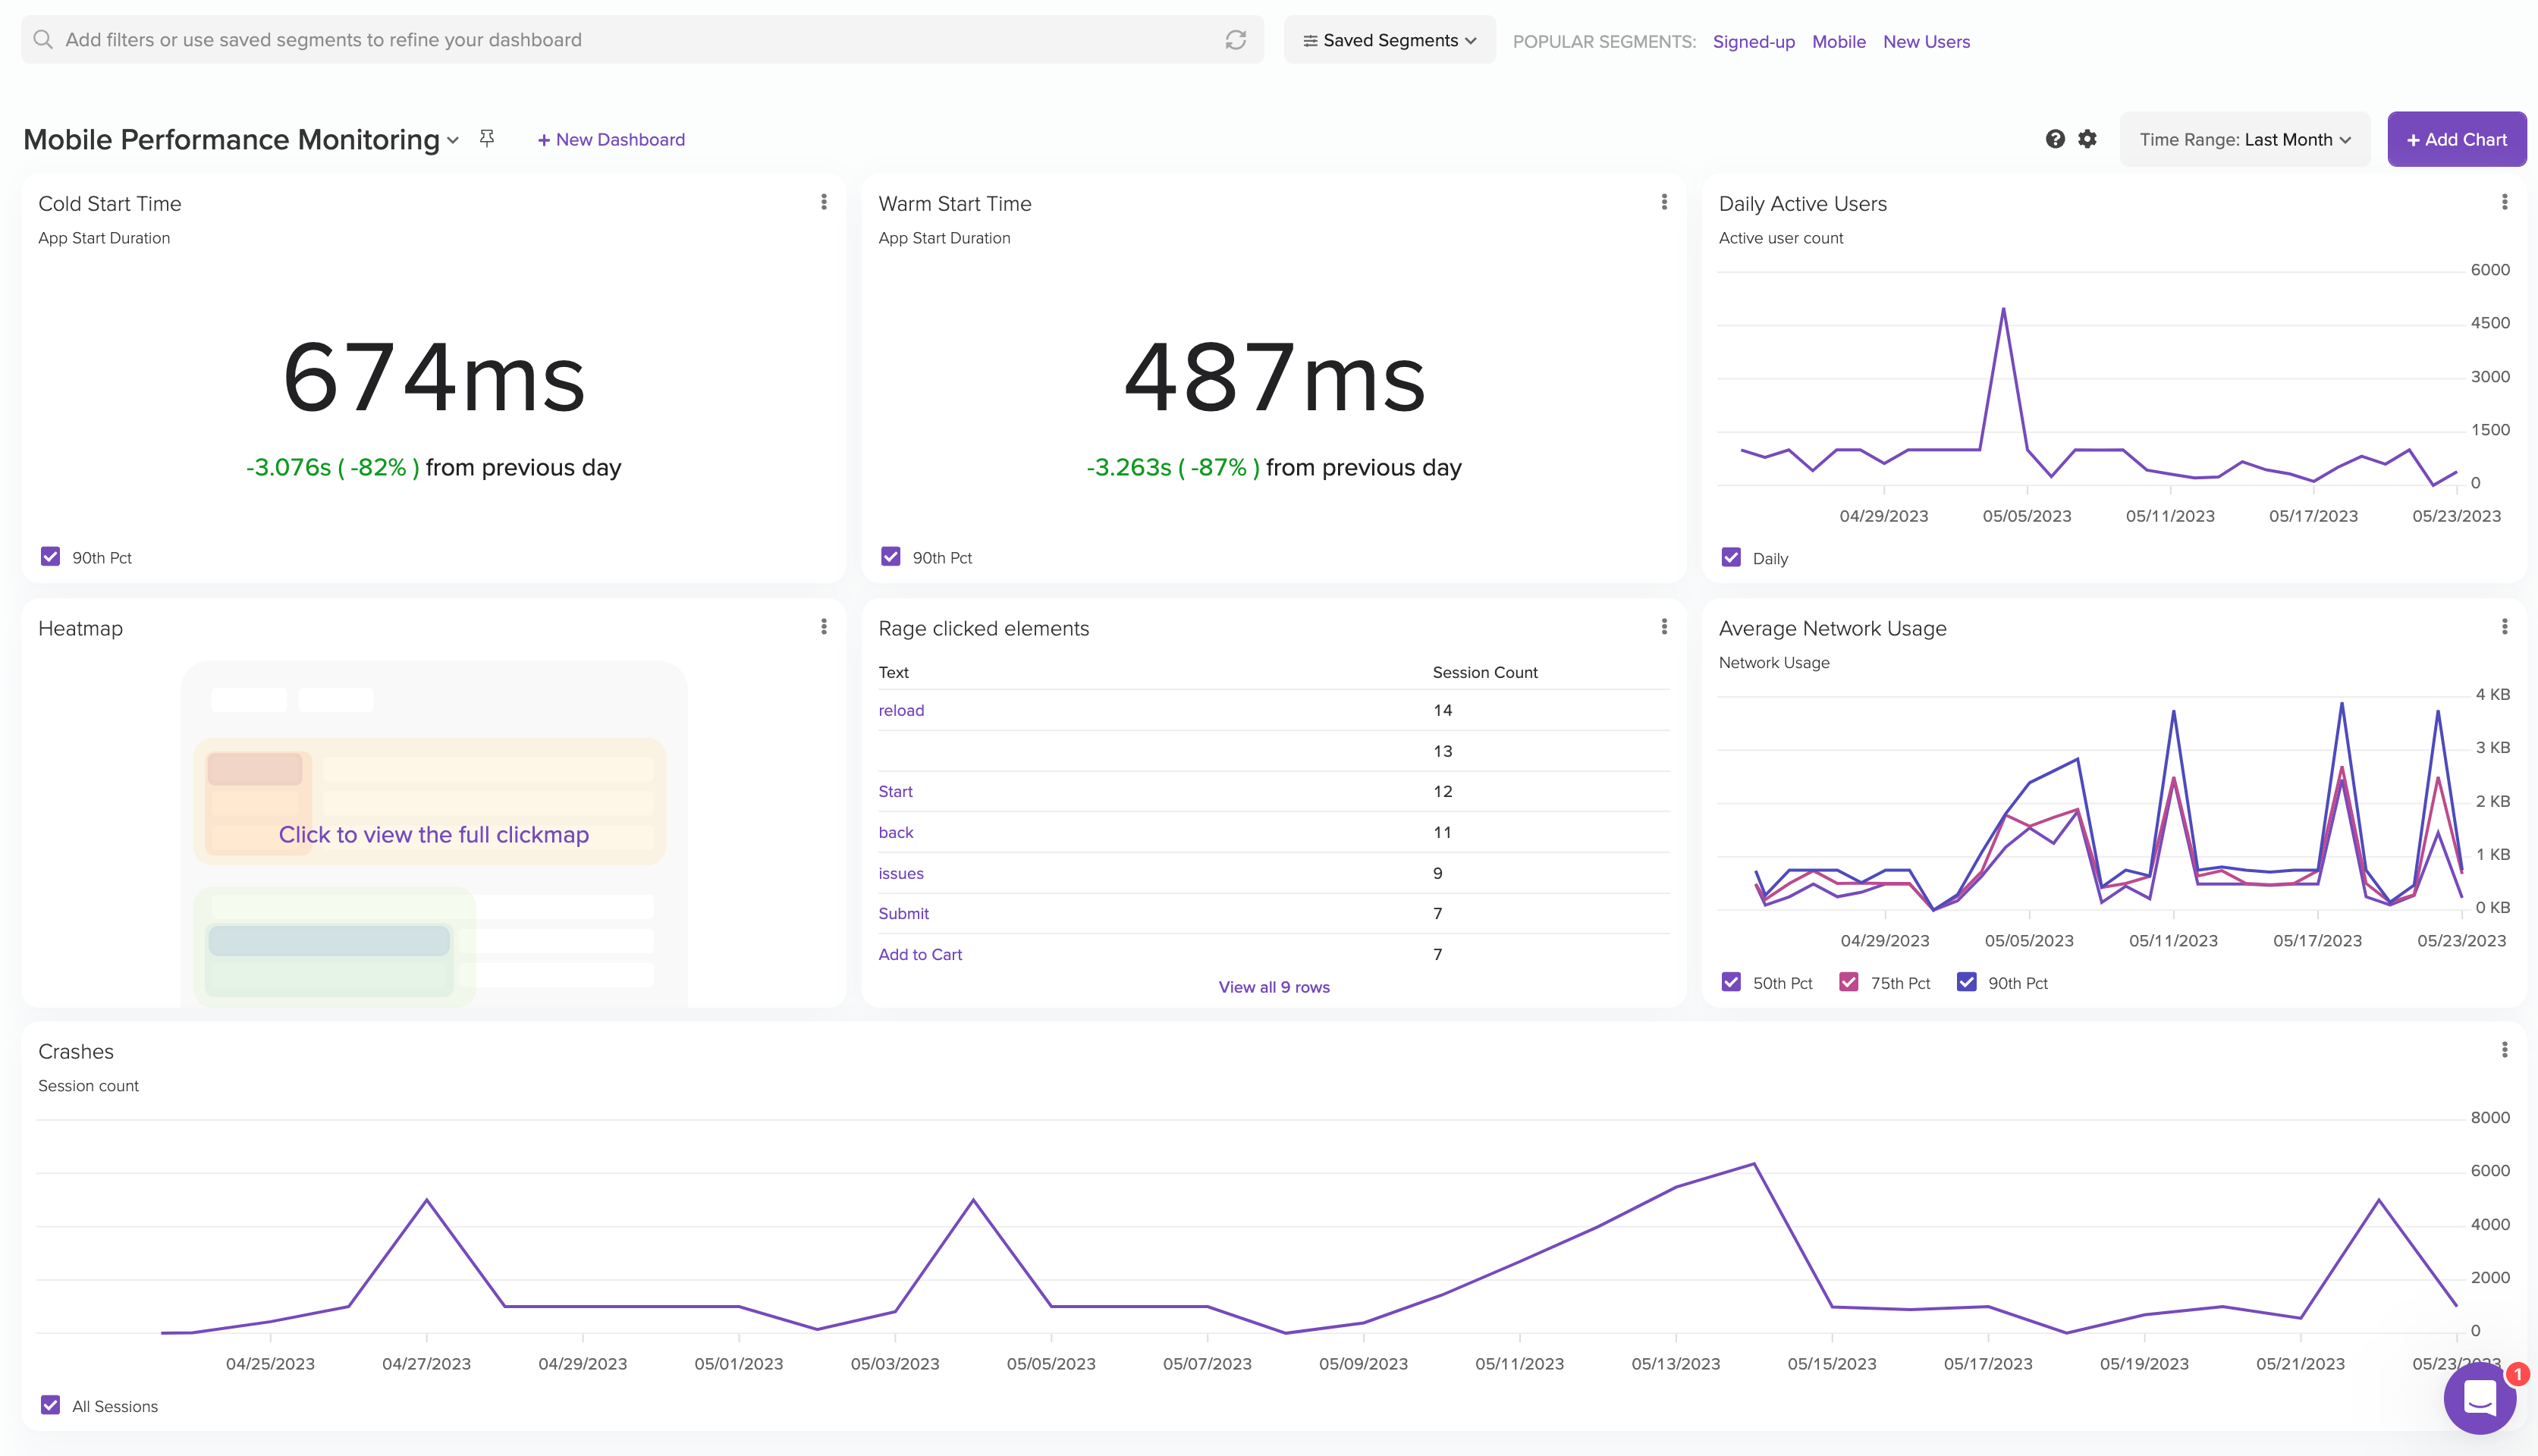
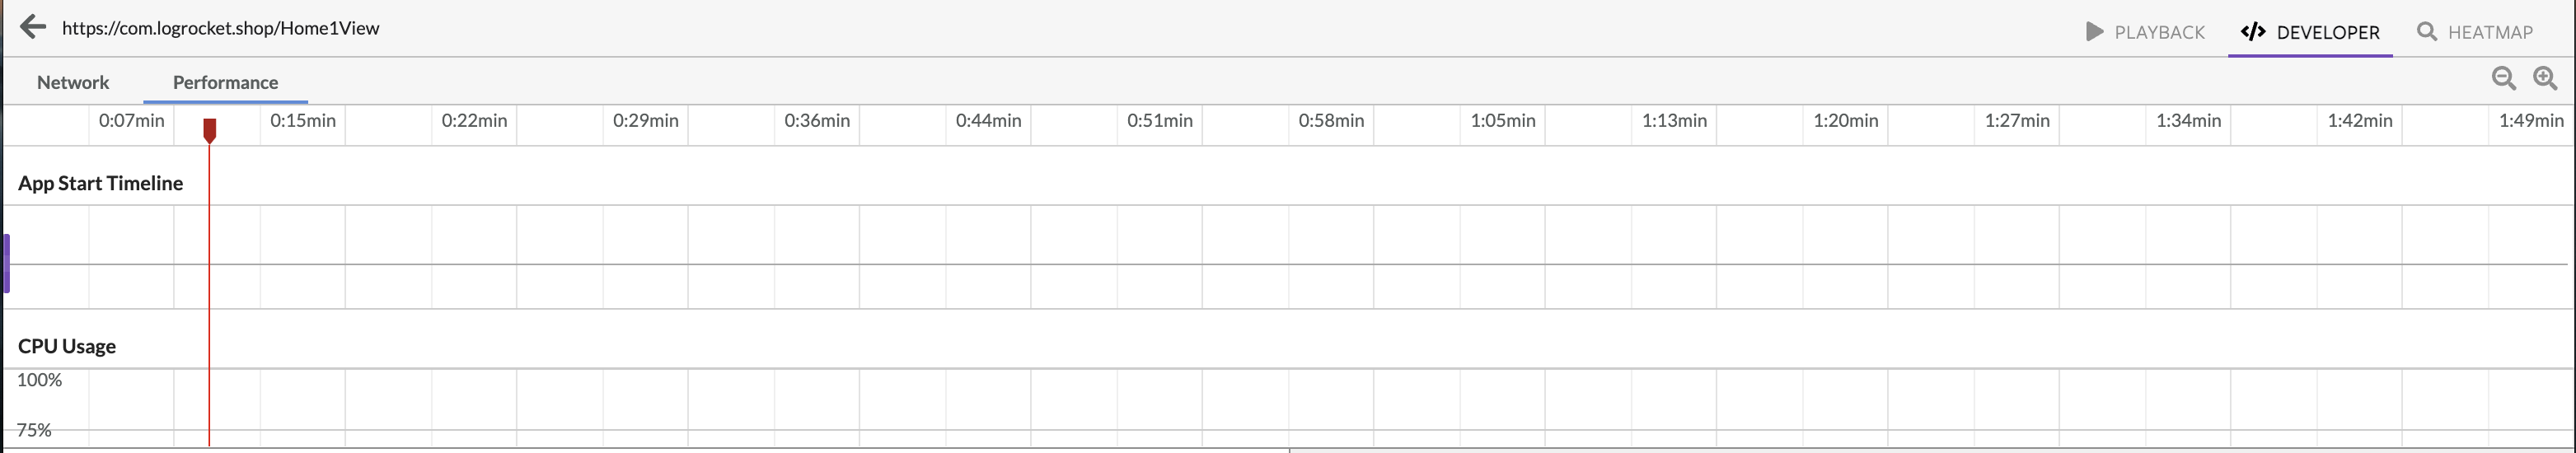
LogRocket breaks down your start time into Cold, Warm, and Hot starts. If a start exceeds Google’s start time recommendations, it is highlighted in red in the Performance tab.
- A cold start is when a user launches your app for the first time after rebooting, or when the app has not been launched for a long time. Google recommends cold starts of up to 5 seconds.
- If you see long cold start times, analyzing the breakdown by device and version can help you spot issues. For example, phones with powerful CPUs may be loading faster, and you may consider reducing the number of assets in your initial UI to accommodate less powerful devices.
- A warm start occurs when the app is running in memory, but some of the cold start tasks need to be re-run. This could occur if a user closes your app and re-opens it. Because some of the application state is stored in memory, this should be significantly faster than cold starts. Android suggests warm start time under 2 seconds.
- A hot start, or a resume, is when the user reenters your app from app switcher or the home screen. The app is already launched, so while the view needs to be rendered, the activity and application state are already stored in memory. Google suggests hot starts of less than 1.5 seconds
You can inspect the start time for individual sessions in the Performance tab
Frustrated Interactions
Users increasingly expect a seamless experience on your application. Broken links and extremely slow load times can disrupt user workflow, and send them looking for alternatives to complete their task. Proactively monitoring for these areas gives you the time and tools to address blockers to important workflows before the bad reviews start rolling in.
Rage Clicks
Take a look at the elements users are rage clicking on the most. A rage click is defined as repeated taps in a small area of your app in a short period of time. This repeated tapping can indicate that the user is frustrated or that a link is broken.
Watch sessions listed in the metric details to check out what’s happening. If they are clicking on a broken button or link, you can review the network calls and logs to diagnose what’s causing rage clicks.
Performance Impact
Network Throughput, CPU Usage, and Memory Usage, can all help you understand if your app is experiencing performance issues, or causing a poor experience for your users. Typically, mobile teams try to reduce these values for optimal performance, though viewing these metrics in-session can help you diagnose if the app is performing as expected.
If you notice an anomaly in your Timeseries metric, review individual session performance in the Performance tab of session replay.
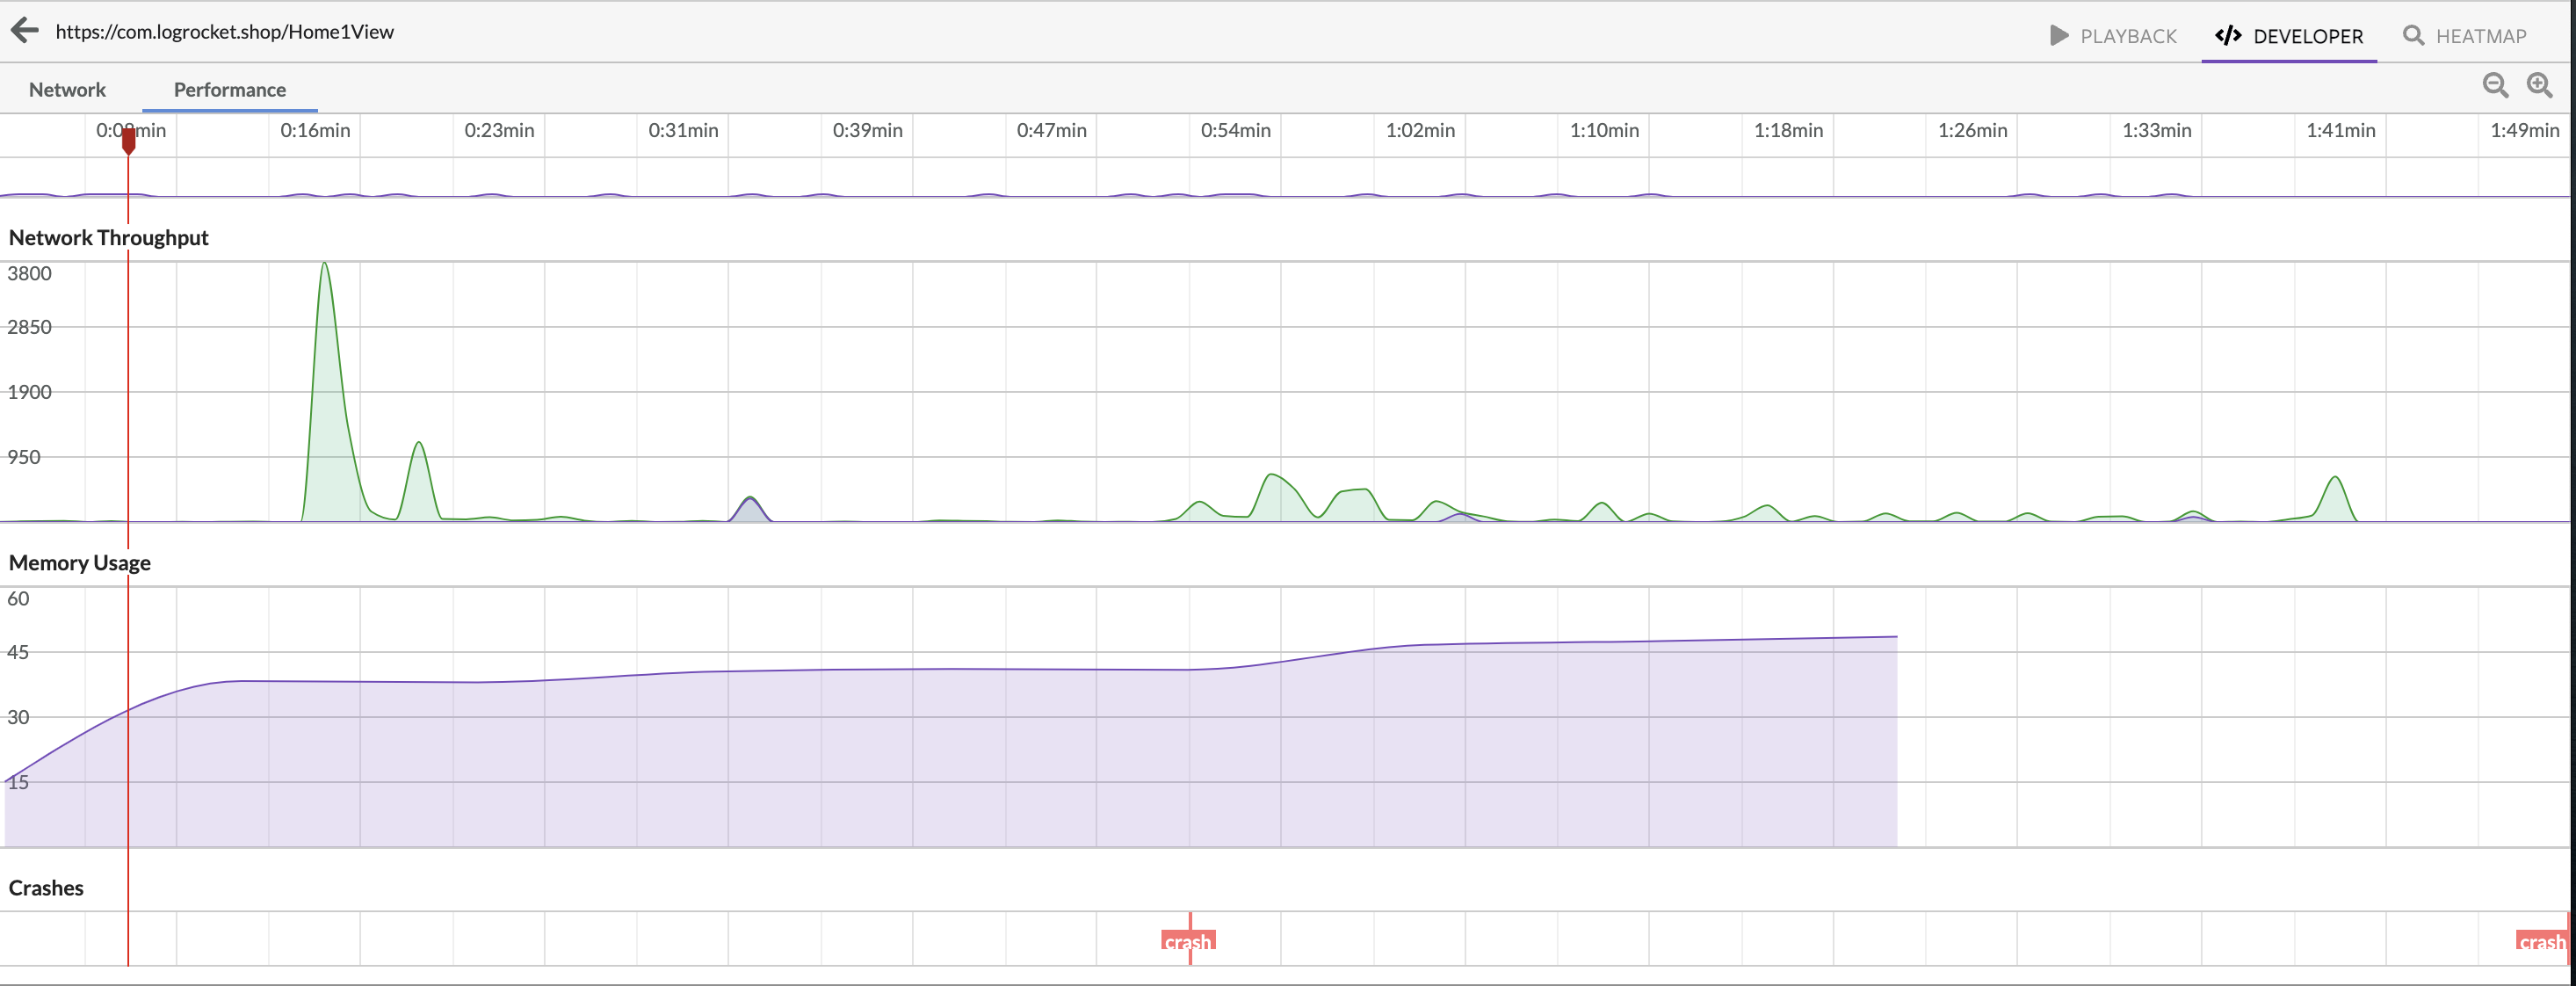
Network Throughput
Network throughput is measured by the number of bytes passed through the device's network interfaces during the last second.
What can network throughput tell you?
- Client Data usage - High network throughput can indicate your app is consuming a lot of data. For users with limited data plans, this can lead to them deleting your app/avoid using up all their data.
- Connection timeouts or slow zones - If users are regularly switching between cellular and wifi, it can indicating slow user experience
- Understand real-world conditions of users - i.e. your app requires downloading a large video before proceeding, but you find users typically don’t have enough bandwidth to complete this. You can change the workflow, or provide a tooltip to the user recommending they connect to wifi before completing this step.
CPU Usage
How its measured: The amount of time the app spent using CPU as a percentage of the total available CPU for that second.
Reducing CPU Usage can help you:
- Lower battery usage of your app. Reducing battery consumption makes your app more reliable, and provides a better experience for your user by ensuring they preserve their battery life for when it’s needed.
- Ensure a faster and smoother user experience
Note: We only record CPU load when it's above ~10% so aggregations and charts created with this data may skew higher than expected.
Memory Usage
How its measured: The current total memory used by the app, measured once every 10 seconds.
High memory usage can slow down your application performance, and even lead to an out of memory (OOM) crash. The more memory your app is using in the background, the more likely the system will free your app’s memory in background, which results in a slower experience when the user switches back to your app.
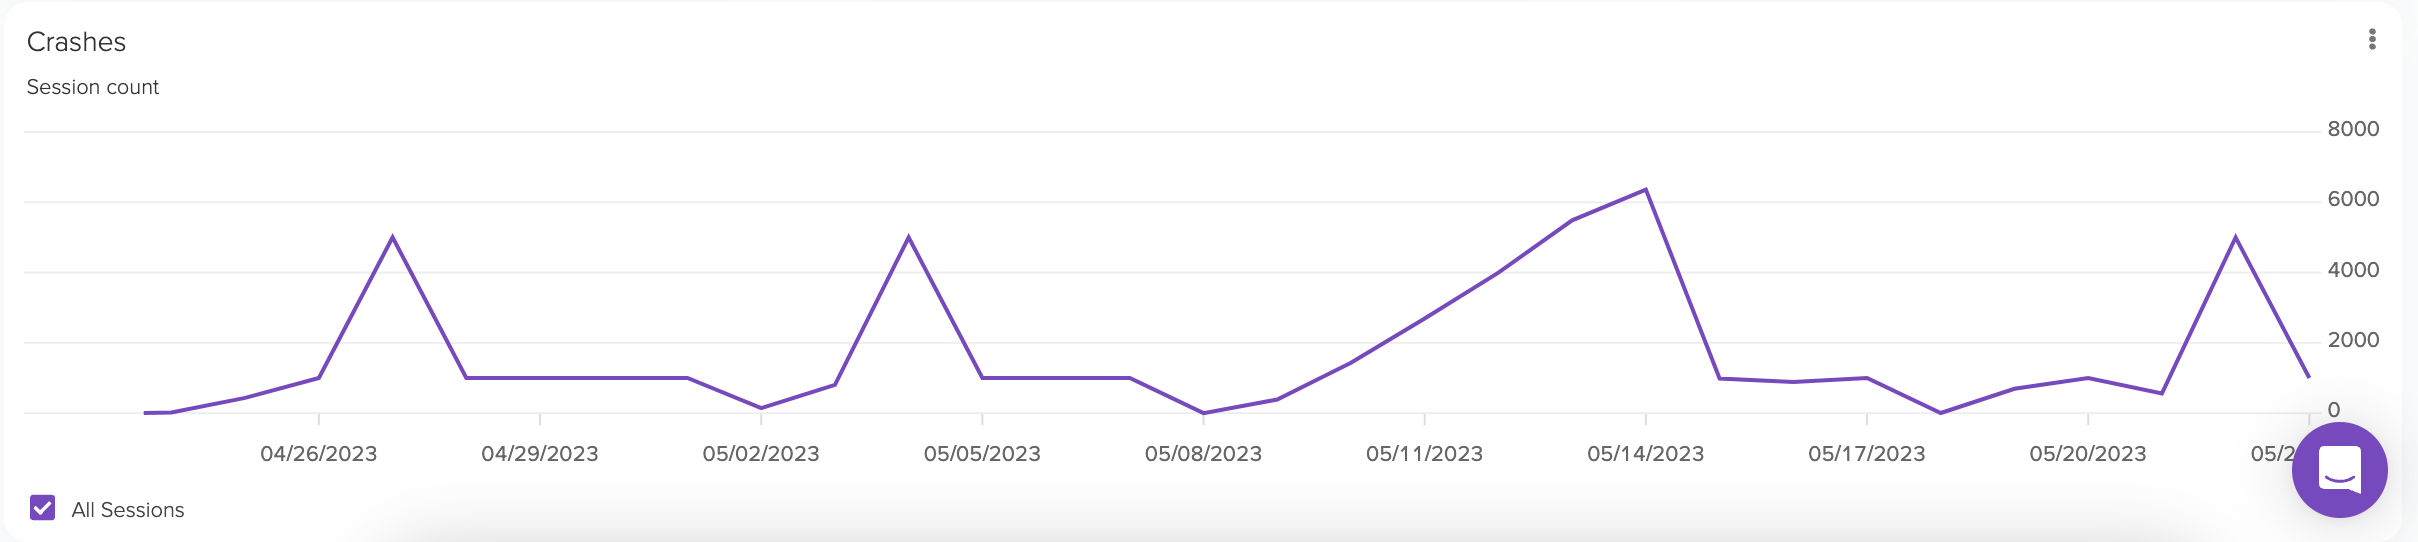
Crashes
Nothing is more frustrating than an app that crashes every time you try to use it. Crashes can cause user frustration, and stop users from performing key tasks. They also are strongly weighted by both Apple and Google play stores in determining the visibility of your app in search results. LogRocket’s Timeseries of Crashes helps you monitor sessions experiencing crashes, and track their frequency over time.
User Flow Metrics
Heatmaps, Path Analysis, and Conversion Funnels all help you understand at a high level how users are interacting with your application. Path Analysis and Conversion funnels help you track user-flow KPIs like “% of users who complete checkout after adding items to cart”, while clickmaps help you understand high-use actions at a glance.
Tagging pages will make these metrics even more useful. Follow our guides for iOS, Android, and React Native page identification.
Creating Definitions can help you and your colleagues better understand your user interactions, by renaming complex selectors with simple language. See this guide to help you define selectors in our Definitions tool.
Updated over 1 year ago