

Performance Monitoring
Overview
LogRocket provides many options for you to monitor the performance of your application, both on an individual session level as well as more holistically with proactive monitoring.
You can use filters to search for specific sessions, view details as part of session playback, and set up charts within our Metrics section to keep tabs on data across all sessions.
Session Playback Performance Tab
In the Developer view within the playback of a specific session, you will see a 'Performance' tab at the top above the session replay.
This is where you'll find data related to Page Load metrics, CPU Usage, Long Tasks, Memory Usage, Browser Crashes, and Network Speed that is specific to the user's session. Some of this data may only be available for specific browsers or operating systems, depending on what they have made available to us.
Available for Web Sessions Only
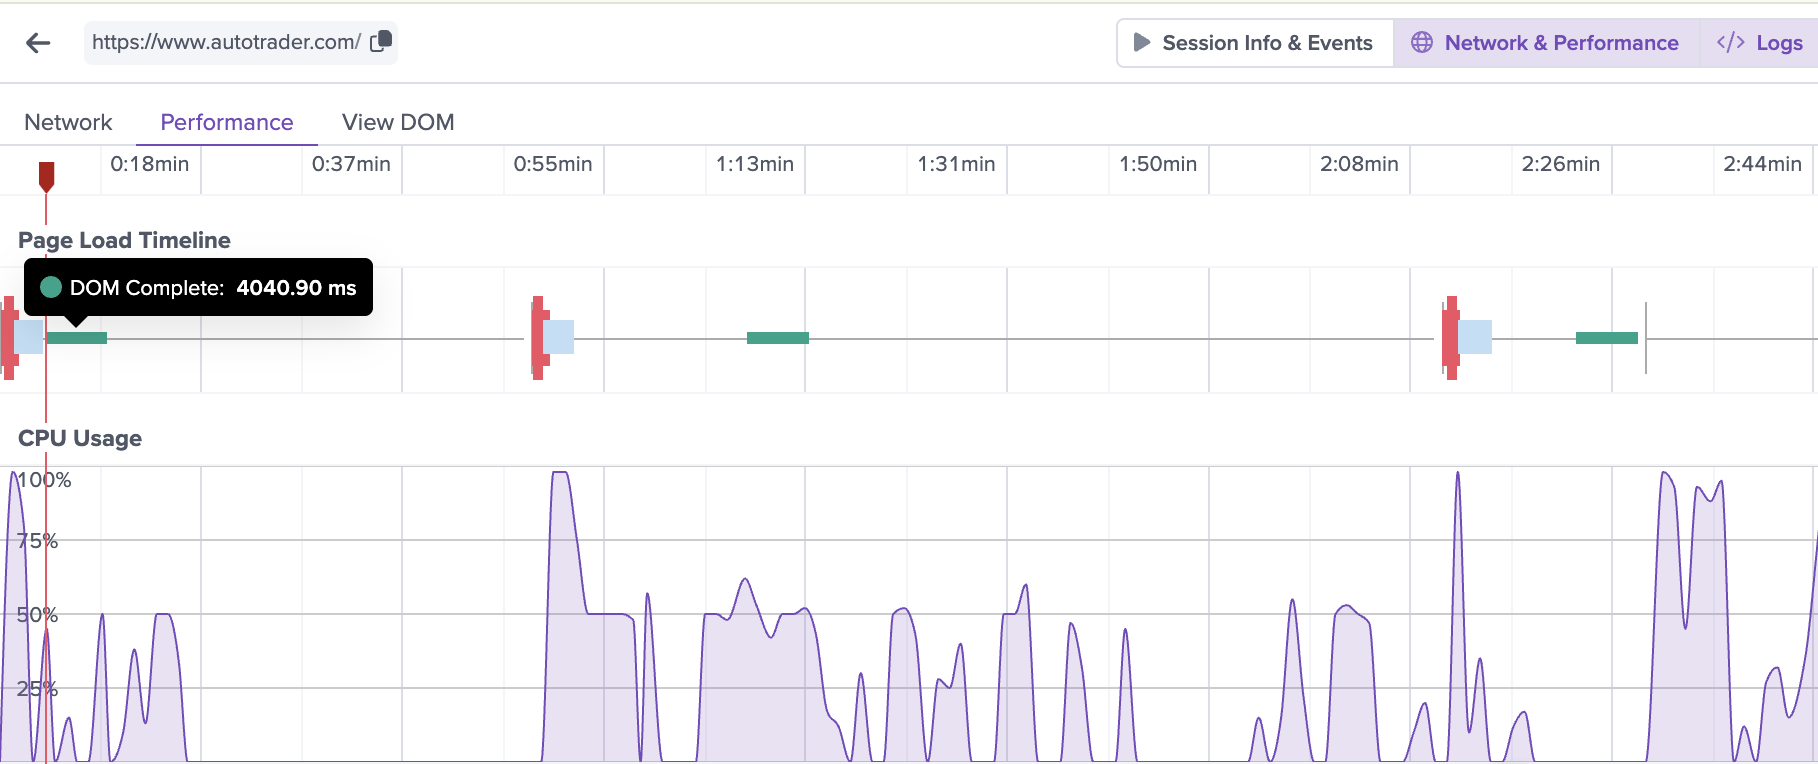
Page Load timeline
Displays metrics regarding page load times for each new page loaded within a session. You can mouse over the different colored bars to get the exact number for each metric.
The metrics displayed include
- Time to First Byte - duration from the user or client making an HTTP request to the first byte of the page being received by the client's browser
- DOM Complete - measures when all processing on the page is complete and resources have finished downloading
- Largest Contentful Paint (LCP) - render time of the largest image or text block within the viewport, providing a user-focused method for measuring actual time of page load. For more information, see here.
- First Input Delay (FID) - measures the time from when a user first interacts with a page to the time when the browser is actually able to begin processing event handlers in response to that interaction. For more information, see here.
Please note that you may not see all metrics represented for each page -- this is due to nuances in how we collect each metric type. For example, LCP, FID, and CLS (described below) are not registered if a user opens a page in a new hidden tab.
Additionally, some of these metrics are only supported on modern browsers. LCP, FID, and CLS are supported only for Chrome, Edge, and Opera.
Cumulative Layout Shift
CLS is a measurement of visual stability. For more details, see here. The display here shows a measurement of individual layout shifts per page, summing to the total CLS towards the end of each page lifecycle.
Long Tasks
Surfaces any long tasks that run for more than 250ms. Only supported for sessions on Chrome.
Available for Web and Mobile Sessions
CPU Usage
For Web sessions, this displays the average CPU usage of the application within the user's browser throughout the session. This is only displayed for sessions recorded on Chrome and Firefox browsers.
For Mobile Sessions, this measures the amount of time the app spent using CPU as a percentage of the total available CPU for that second.
CPU load metrics may skew highWe only record CPU load when it's above ~10% so aggregations and charts created with this data may skew higher than expected.
Memory Usage
For Web Sessions, displays the amount of memory that is being utilized throughout a session. Only supported for Chrome.
For Mobile sessions, this displays the current total memory used by the app, measured once every 10 seconds.
Crashes
For Web Sessions, this shows instances of a browser crash throughout the session playback. You must configure this in advance by following the instructions here. This is only supported for Chrome.
For Mobile Sessions, this shows app crashes.
Network Speed
For Web sessions, this shows the average speed of the user's connection throughout the session as well as the estimated connection type and any losses of connectivity. This is an average value calculated based on the speed of assets downloaded on page load. This is supported for Chrome, Firefox, and Opera in some instances.
May be inaccurate for SPAsGiven the algorithm we're using to calculate the speed, the Average Network Speed we display may be inaccurate particularly for single-page applications. You may see a flat line because our measurements are based on page load, and for SPAs there may only be a single page load to base measurements off of.
For Mobile Sessions, LogRocket displays Network Throughput. This is measured by the number of bytes passed through the device's network interfaces during the last second. App throughput and device throughput are noted separately, when hovering over a point in the graph. On iOS, app throughput is estimated for encoded network traffic.
Available for Mobile Only
App Start Time
LogRocket breaks down your start time into Cold, Warm, and Hot starts. The start is displayed in purple if under Google's recommended times for each start type, and red if it exceeds those times.
A cold start is when a user launches your app for the first time after rebooting, or when the app has not been launched for a long time. Cold start time measures the time from when the app process begins, to when the first screen finishes rendering. Google recommends cold starts under 5 seconds.
A warm start occurs when the app is running in memory, but some of the cold start tasks need to be re-run. This could occur if a user closes your app and re-opens it. Because some of the application state is stored in memory, this should be significantly faster than cold starts. Android recommends warm starts under 2 seconds.
A hot start, or a resume, is when the user reenters your app from app switcher or the home screen. The app is already launched, so while the view needs to be rendered, the activity and application state are already stored in memory. Google recommends hot starts under 1.5 seconds.
LogRocket displays the total time of the app start, even if some activities may begin before LogRocket is initialized and the session begins. A detailed breakdown of each stage is displayed when hovering over the graph.
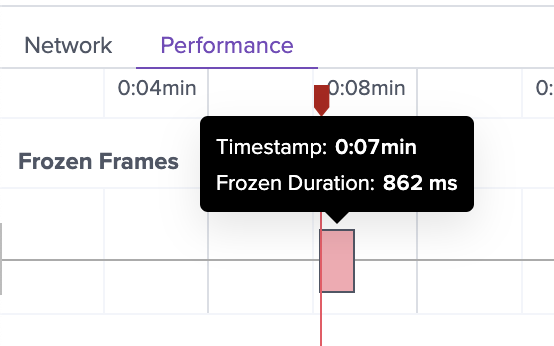
Frozen Frames
A frozen frame is a frame that takes over 700ms to render in your application. We measure this by timing how long execution on the main UI thread is blocked.
This means that the user is unable to interact with your app, and it may appear frozen. In the Performance graph, LogRocket indicates the timestamp where the frozen frame occurred and the duration it was frozen.
Updated 11 months ago