

Product Analytics
Overview
LogRocket supports quantitative analysis of your data using:
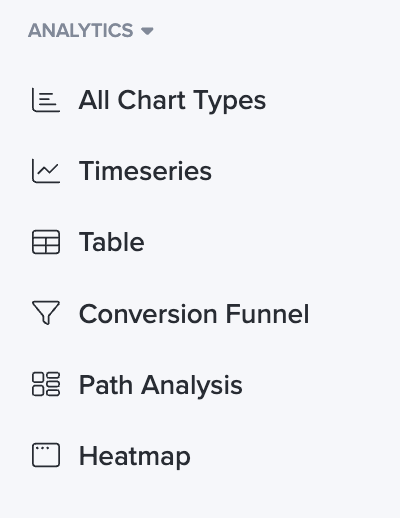
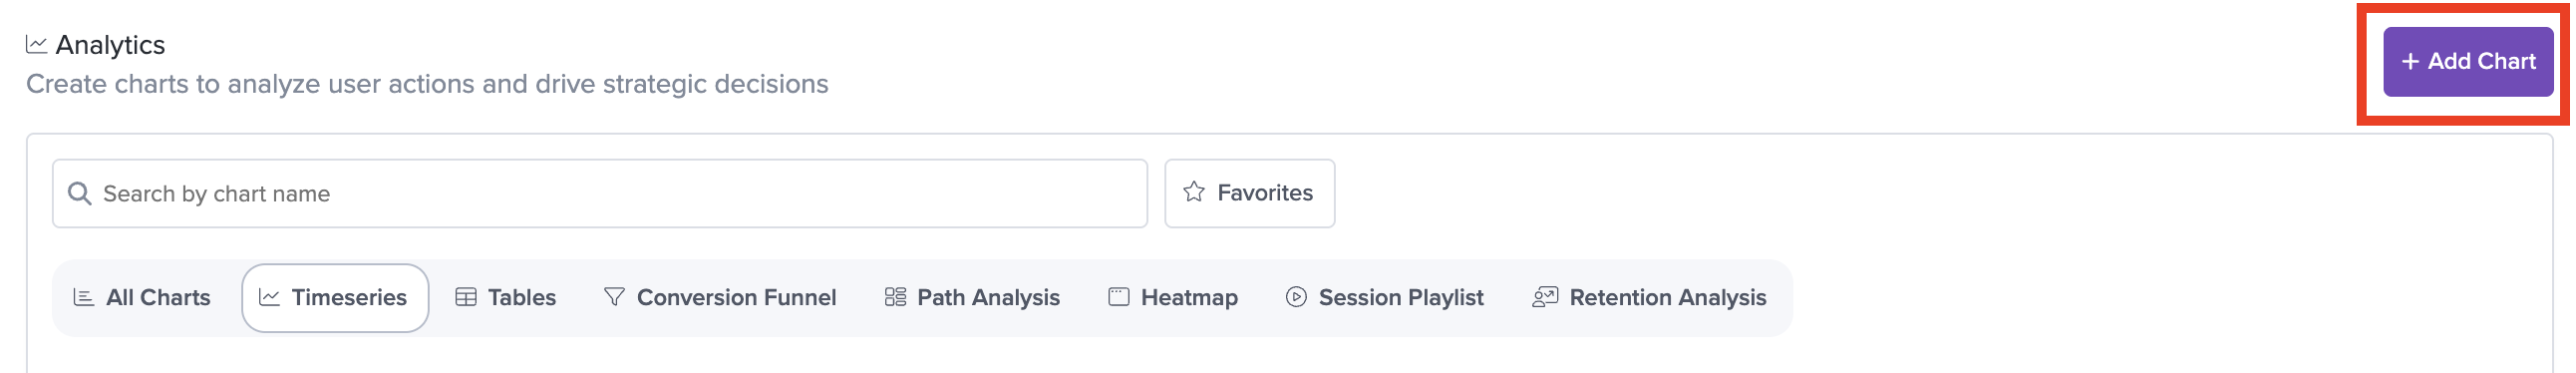
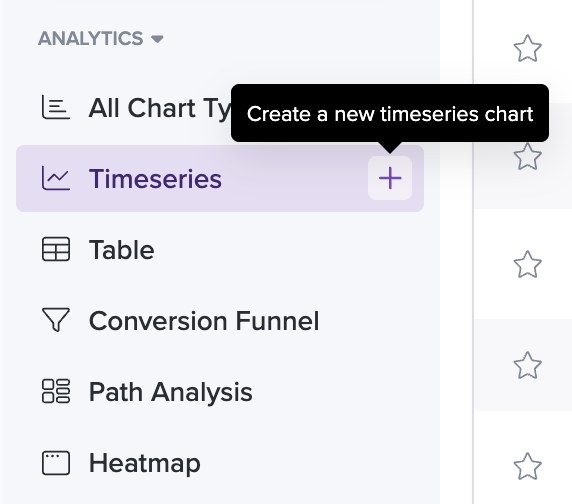
To get started, select one of these chart types on the left side of the dashboard and selecting "Add Chart" in the top right corner. Additionally, if you hover over a chart type in the side nav you will see a + sign which you can use to build a new chart.
Metric Configuration Options
Time Range, Intervals, and Comparison Time Ranges
The time range, interval, and comparison time range are saved with the metric. This allows you to consistently view a particular metric for either a specific date range (i.e Feb 2nd - Feb 4th) or relative date range (i.e last week.)
When arriving at a metric from a dashboard, the dashboard time range will be shown in the metric. From here, you can either save the new time information, or reset the metric to return to the saved time range of the chart.
Create metric from network request in session playback
You can also create a Metric chart directly from a network request within session playback. For more information, see the video below:
Updated about 1 month ago