

Clickmaps
Overview
LogRocket provides clickmaps and heatmaps for each page of your application, accessible in two different ways. These show you the parts of your page that your users are clicking on most frequently. You can view heat maps for most clicked, most rage clicked, and most dead clicked elements.
Session Playback View
LogRocket allows you to create a heatmap directly from session replay. This will show you the parts of your page that your users are clicking on most frequently.
To create a heatmap for a specific page, open a session in which the desired page is visited. Find a moment in the session you would like to view a heatmap for and pause the playback. From the Tools dropdown in the bottom-right, click the "Create Heatmap" option:
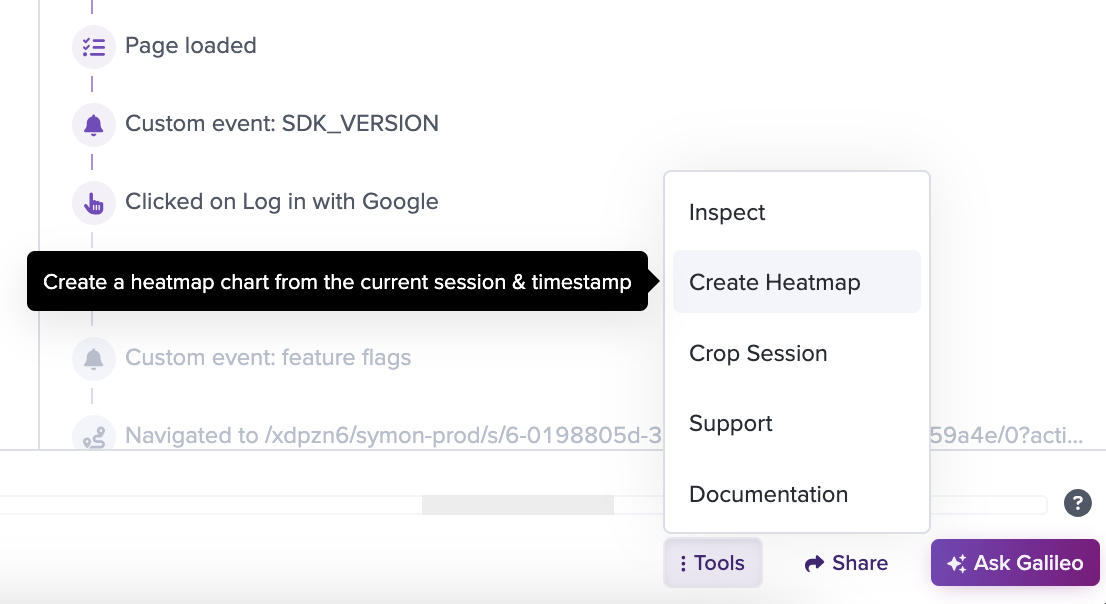
This will open a new tab where you can view and edit a heatmap generated from the session moment you had paused on. By default this will be a Clickmap, but can be changed to another heatmap type if desired (see Metrics View below).
Filtering sessions
If you would like to drill into a specific click within the clickmap, hit the Add to filter button below the click you want to track. This will add the CSS selector to your existing filter and show sessions where the specific interaction took place.

Metrics View
You can also create a Heatmap within the Metrics tab.
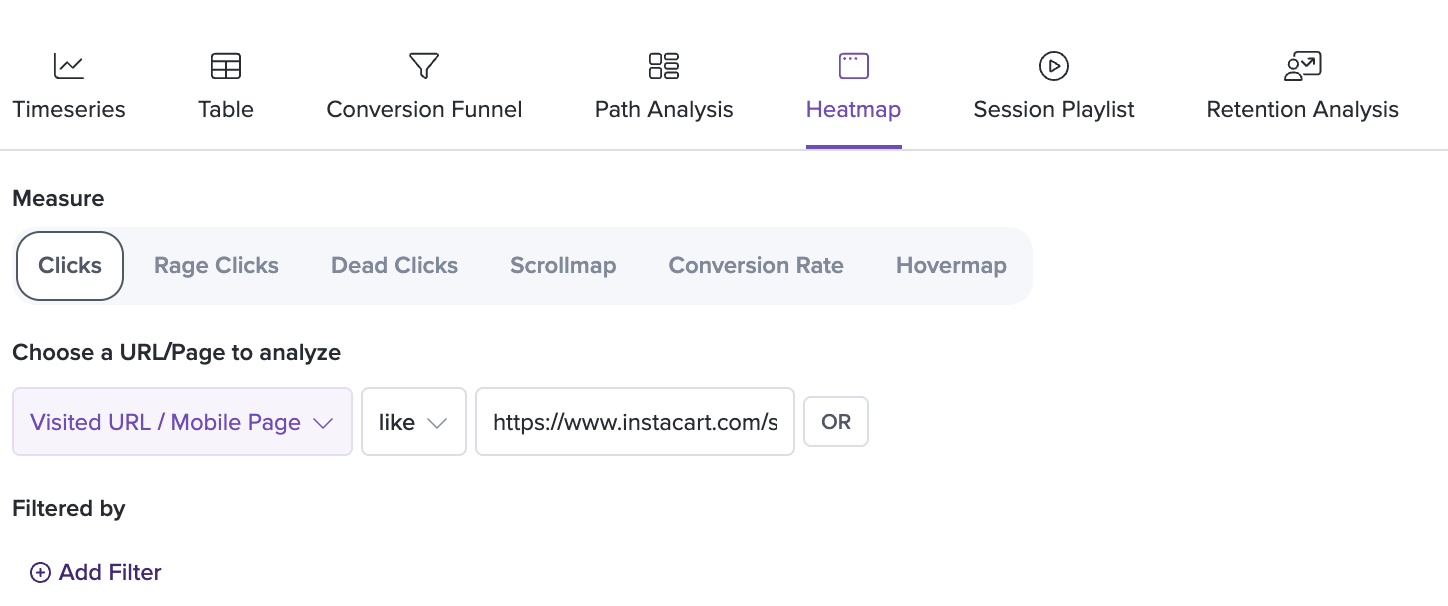
In the 'Add Chart' pane, select 'Heatmap' as the Metric type and then define the URL that you want to see the heatmap for.
After you define the URL and add filters as desired, click 'Save Chart'.
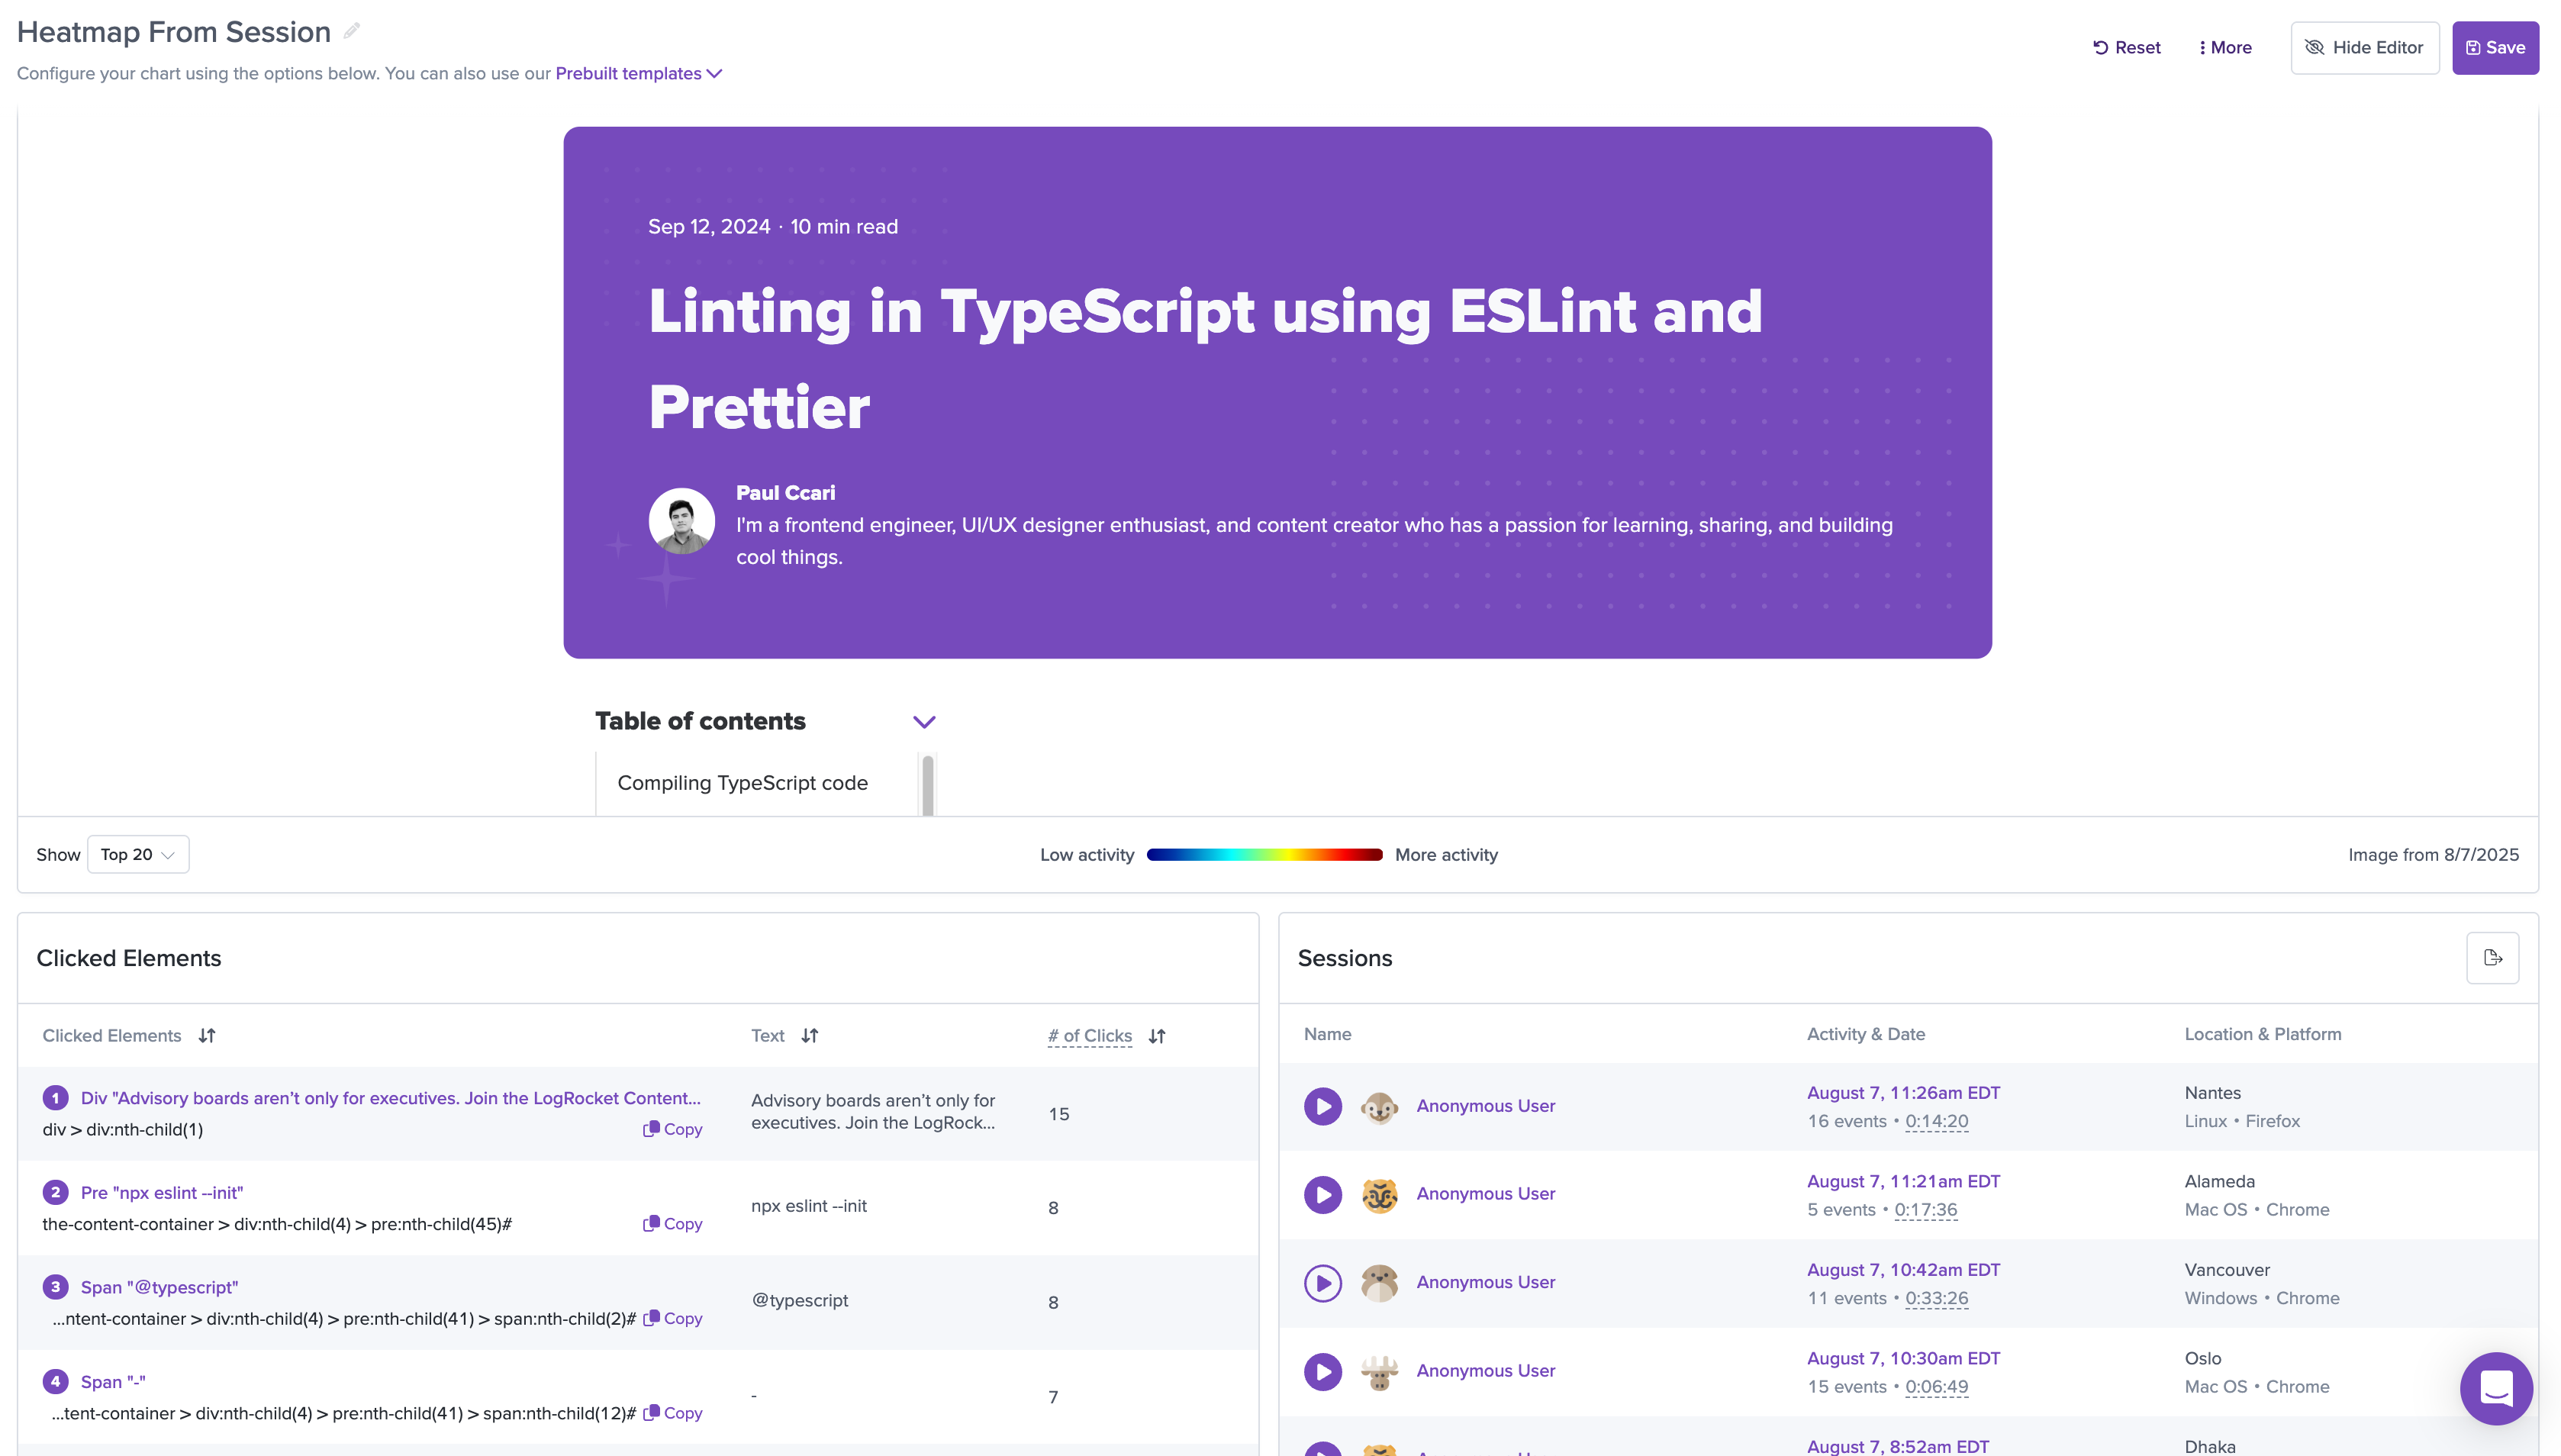
You will be taken to the Heatmap detail view, where you'll see an overlay of the page that you selected alongside metadata about the element with the highest number of clicks. There is also a list of sessions below the heatmap, showing sessions in which a user has visited the page. This allows you to easily pair quantitative data from the heatmap alongside the qualitative data of seeing how users are actually interacting with the page.
Video walkthrough
Updated 11 months ago