

Alerting on Timeseries
Alerts on Timeseries charts notify you when a metric meets a trigger condition or deviates from its expected behavior. You can create up to 100 alerts and distribute them across any combination of your timeseries charts. You can add alerting to any timeseries chart type.
You can manage all your alerts in one place, on the Alerts page in Settings.
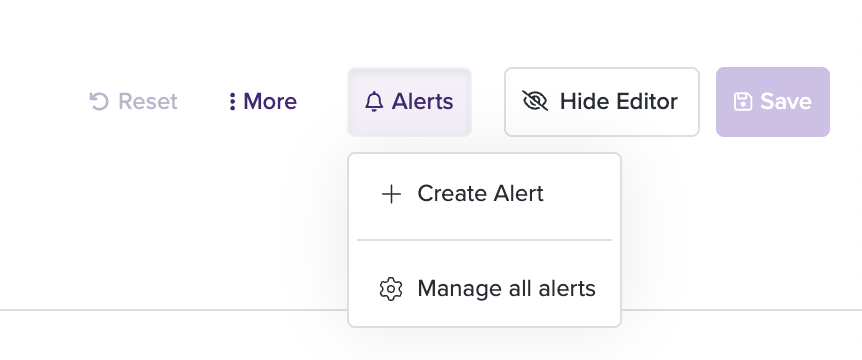
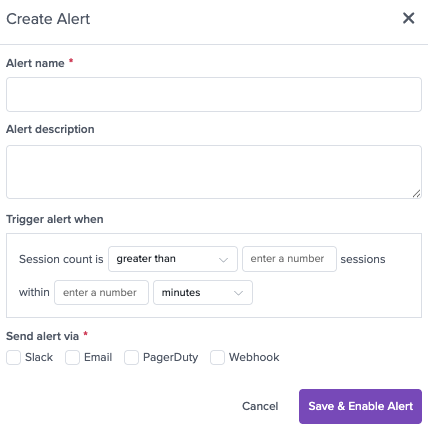
Configuring an alert
Alerts are configured when creating or editing a chart. Currently, alerts are only supported for Timeseries charts.
Each alert associated with a chart can have a different alert method and destination.
Alert methods
Choose how LogRocket determines when to trigger an alert:
Trigger condition
Trigger conditions use a fixed threshold that you define. For example, you can trigger an alert when active users fall below four within one hour. Use this method when you already know the acceptable limit for a metric.
A trigger condition has the following settings:
- Operator: Whether the alert triggers when the metric is greater than or less than the threshold.
- Threshold: The value the metric is compared against, in the chart's unit (for example, a count of sessions or a percentage).
- Time window: The period the metric is evaluated over, in minutes or hours.
Anomaly detection
Anomaly detection calculates an expected range from the metric's historical behavior, accounting for patterns such as seasonality. It triggers an alert when the metric falls outside that range during the selected period. Use this method to detect unusual changes without defining or maintaining a fixed threshold.
An anomaly detection alert has the following settings:
- Direction: Which changes trigger the alert. Choose above to alert on spikes, below to alert on drops, or outside to alert on both.
- Confidence: How wide the expected range is: 90%, 95%, 98%, or 99%. A higher confidence widens the range, so only more unusual values trigger an alert.
- Time window: The period the metric is evaluated over: 5 minutes, 10 minutes, 1 hour, or 1 day.
Every triggered alert can generate an analysis to help you understand the behavior that caused it. You can view your alerts from the Alerts Dashboard. Click an individual alert to open its detail page, where you can see its trigger history and select a trigger to view its analysis.
Alert destinations
LogRocket supports four alert destinations:
1. Email alerts
Email alerts will send a message to an email address when an alert is triggered or resolved. You can use these alerts to notify a single user, or a distribution list within your organization. Emails are sent from [email protected].
2. PagerDuty alerts
LogRocket’s timeseries alerts can be used to trigger and resolve incidents in PagerDuty.
For full details, view the PagerDuty integration page and follow the in-app instructions. You will need to enable this via the Integrations page before the option appears within the timeseries alert dropdown.
3. Slack alerts
The Slack alert type will deliver a rich message to Slack. Configure an incoming webhook integration in Slack, and paste that URL generated for that integration into the alert’s target URL.
4. Webhook alerts
Webhook alerts allow you to deliver an information payload to an arbitrary URL when an alert is triggered or resolved. The webhook payload contains the following fields:
| Field | Type | Description |
|---|---|---|
status | string | "triggered" or "resolved" |
alert_id | string | A unique ID for an alert. This ID remains the same between multiple triggerings and resolutions of the same alert. Thus, it can be used to track the state of an alert over time. |
project_url | url | A link to the LogRocket project. |
dashboard_url | url | A link to the dashboard containing the chart where this timeseries chart is defined. |
metric_url | url | A link to the chart describing this timeseries. |
reason | string | A human-readable description of the alert definition, based on the values in the alert_settings object. |
alert_settings.detection_mode | string | The alert detection mode: "STATIC" (trigger condition) or "ANOMALY" (anomaly detection). |
alert_settings.threshold | number or null | Defined for static alerts only. The timeseries chart threshold defined for the alert. |
alert_settings.operator | string or null | Defined for static alerts only. "LT" (less than) or "GT" (greater than). |
alert_settings.threshold_unit | string | The unit of evaluation for the timeseries chart. |
alert_settings.interval | number | The time interval over which to evaluate the timeseries chart, in interval_unit units |
alert_settings.interval_unit | string | The unit of the time interval: "MINUTES" or "HOURS". |
alert_settings.anomaly_direction | string | Defined for anomaly detection alerts only. What triggers the alert: "SPIKES", "DROPS", or "BIDIRECTIONAL". |
alert_settings.baseline.lower | number or null | Defined for anomaly detection alerts only. The lower bound of expected values that triggered or resolved the alert, rounded to two decimal places. |
alert_settings.baseline.upper | number or null | Defined for anomaly detection alerts only. The upper bound of expected values that triggered or resolved the alert, rounded to two decimal places. |
alert_settings.baseline.center | number or null | Defined for anomaly detection alerts only. The center of expected values that triggered or resolved the alert, rounded to two decimal places. |
Alerts Dashboard
You can view and manage all of your metric alerts from across all of your charts on the Alerts Dashboard, available within the Alerts tab in Settings:
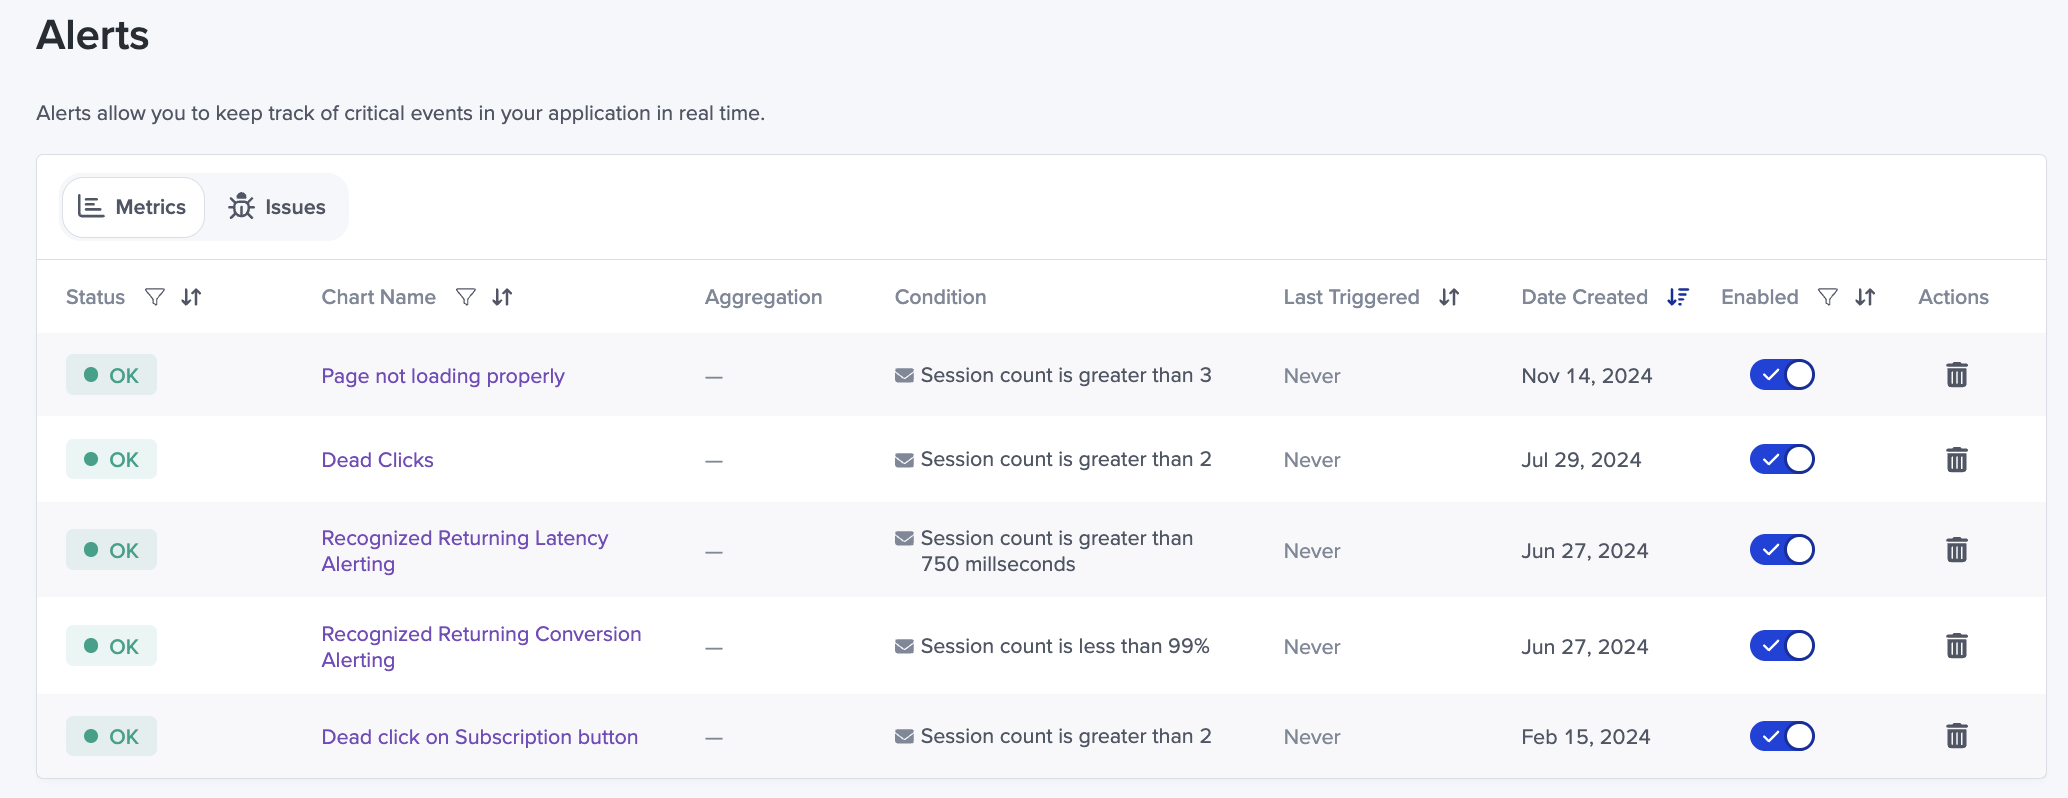
Note that you can also view your Issues alerts here.
Updated 5 days ago