

Path Analysis
Overview
Path Analysis helps you track the user journey throughout your application. Starting from any funnel step, you can click the Analyze this step link to discover where within your application users may be going, particularly if they drop out of the desired funnel.
Using the funnel step as a starting point, LogRocket shows you any navigation, click, and custom events that your users took within the application. This is a great way to understand the user journey and whether your users may be getting distracted by certain pages or links while within a critical funnel.
You can also choose to create a Path Analysis from any defined starting point, not just within a funnel. LogRocket supports both forward and reverse Path Analysis, so you can see the most common user journeys either starting or ending at a specific step.
Chart Creation
From either the 'Add Chart' menu within the Dashboard tab or the Path Analysis tab itself, select 'Path Analysis' as the Metric type. You can choose between 'Starting at Step' and 'Ending at Step' depending on whether you want to see a forwards or reverse Path Analysis. You can also select which event types you want to displayed within the Path Analysis chart, depending on what insights you are looking to understand.
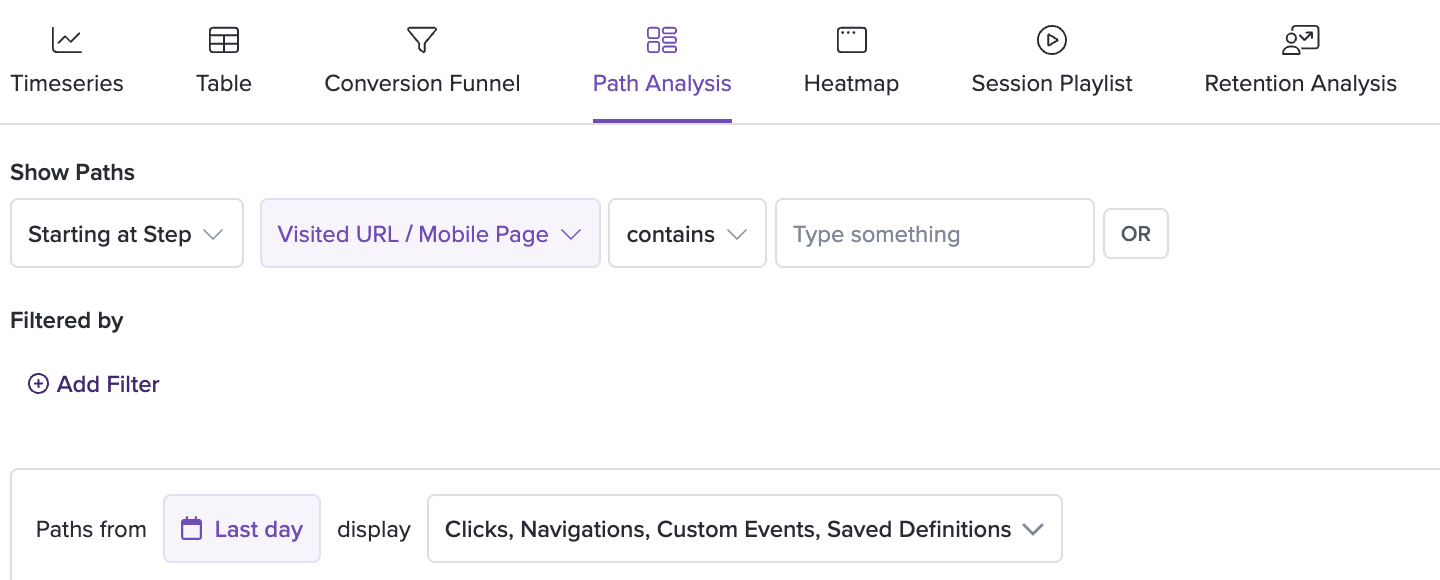
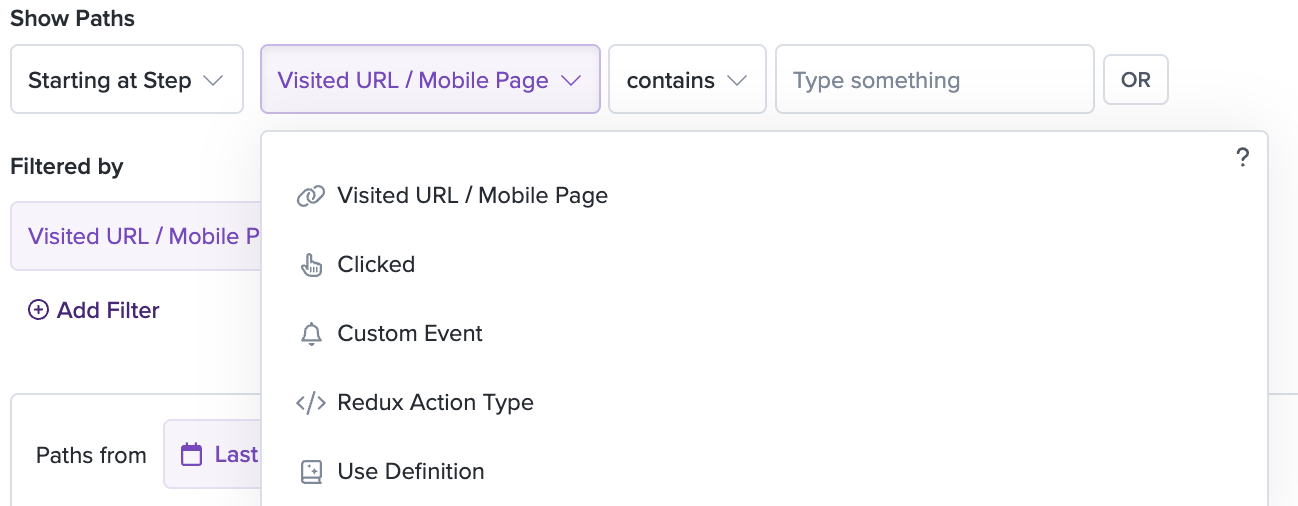
Then, use the Entry or End Point section to define the step that you want the Path Analysis to start or end on. This can be a custom event, a specific URL, a Redux action, a Definition or a click event. Then, click 'Save Chart'.
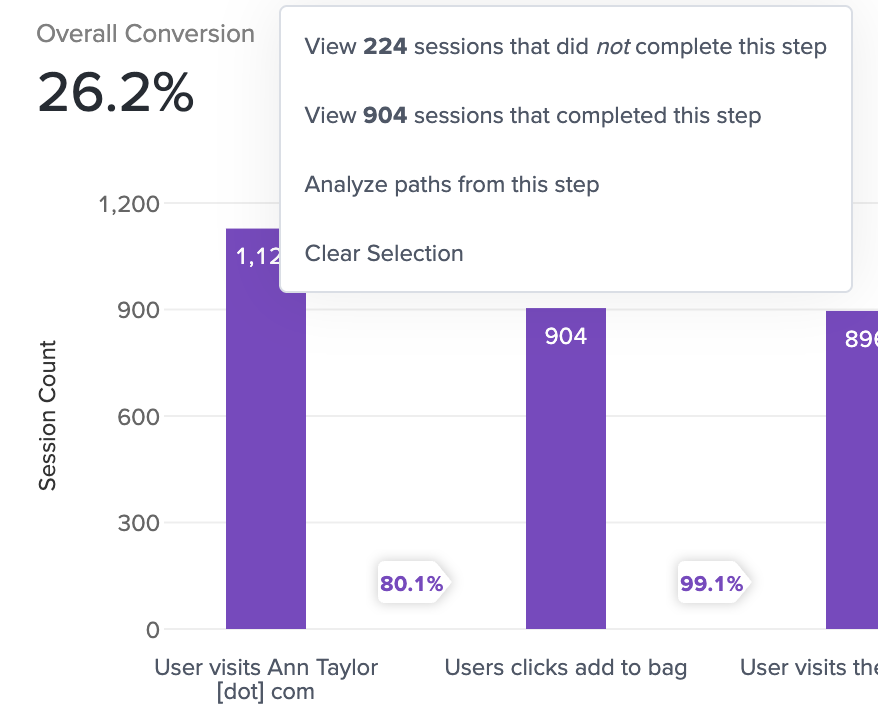
Funnel Example
From either the full funnel detail view or the dashboard view, click Analyze this step.
Path Analysis view
This will take you to the Path Analysis view of the step. The step you just selected is the starting point of this chart. From here, you can see all the subsequent steps users took within your application after completing the selected step in the funnel.
The step names and percentages show you the most common paths that users took. You can click on any path within the chart and view sample sessions from users who have taken this particular journey. These are listed below the chart.
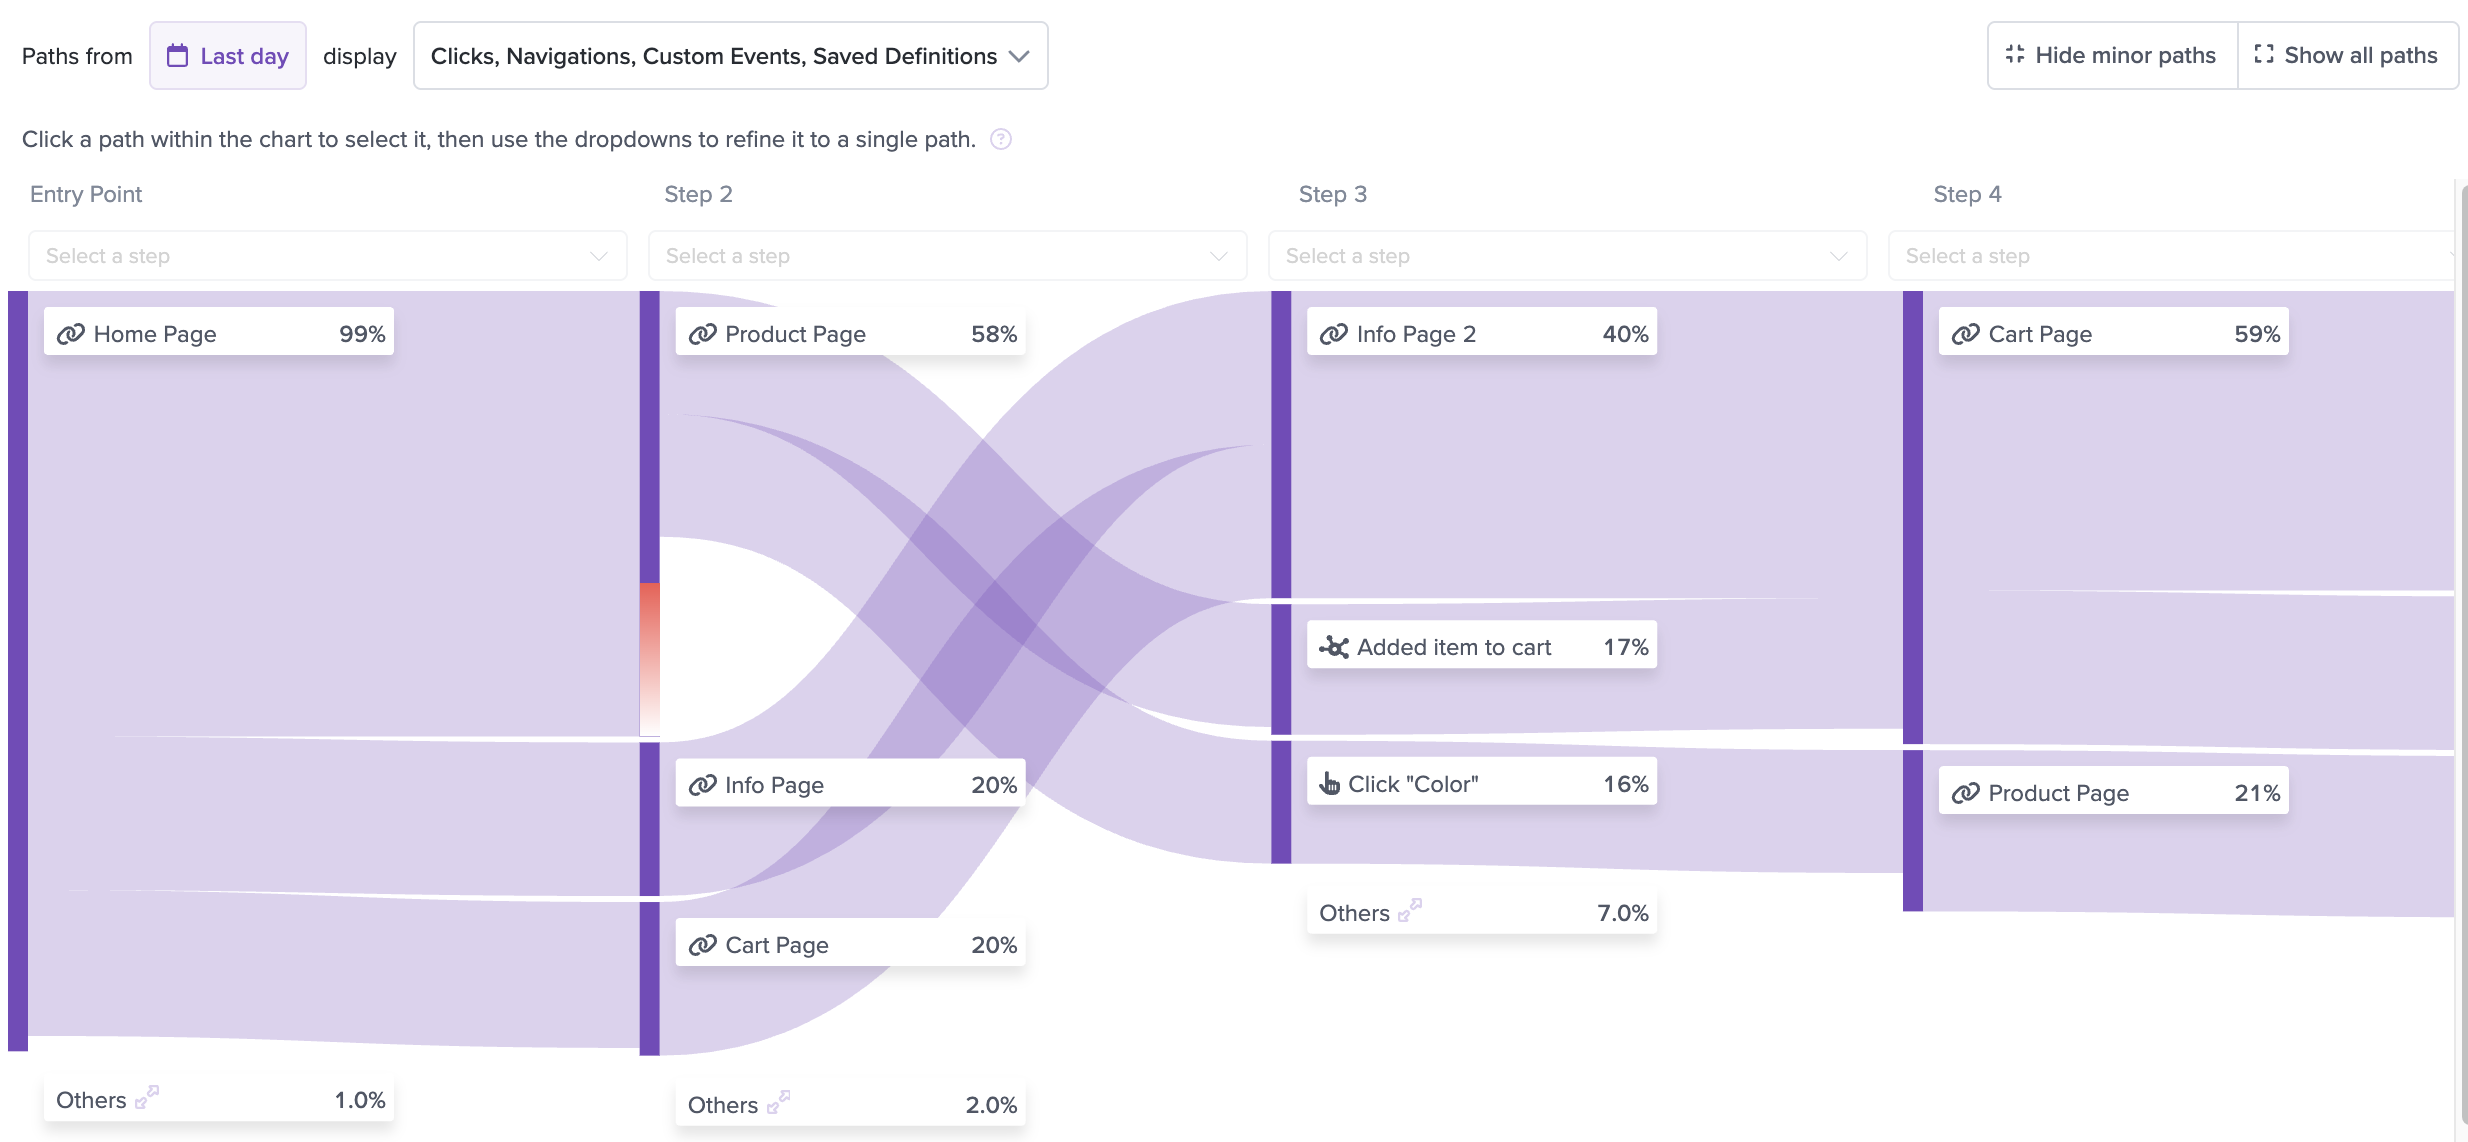
The dropdowns at the top allow you to specify a single path to view associated sessions and issues from. Use each dropdown to choose a specific step at each point along the path.
A note on percentagesNote: Occasionally the percentages for a step will not add up to 100%. This is a known limitation of path analysis charts and intentionally done to improve performance.
Definitions
You will see the Definitions that you have created within your Path Analysis chart. For example, suppose you have created a Definition called "Checkout Page" which is defined as any visits to a URL containing 'checkout'. In addition to seeing the entire URL string within the Path Analysis chart when you hover over a particular step, you will also see the more business-friendly name "Checkout Page" displayed.
Issues in Path Analysis
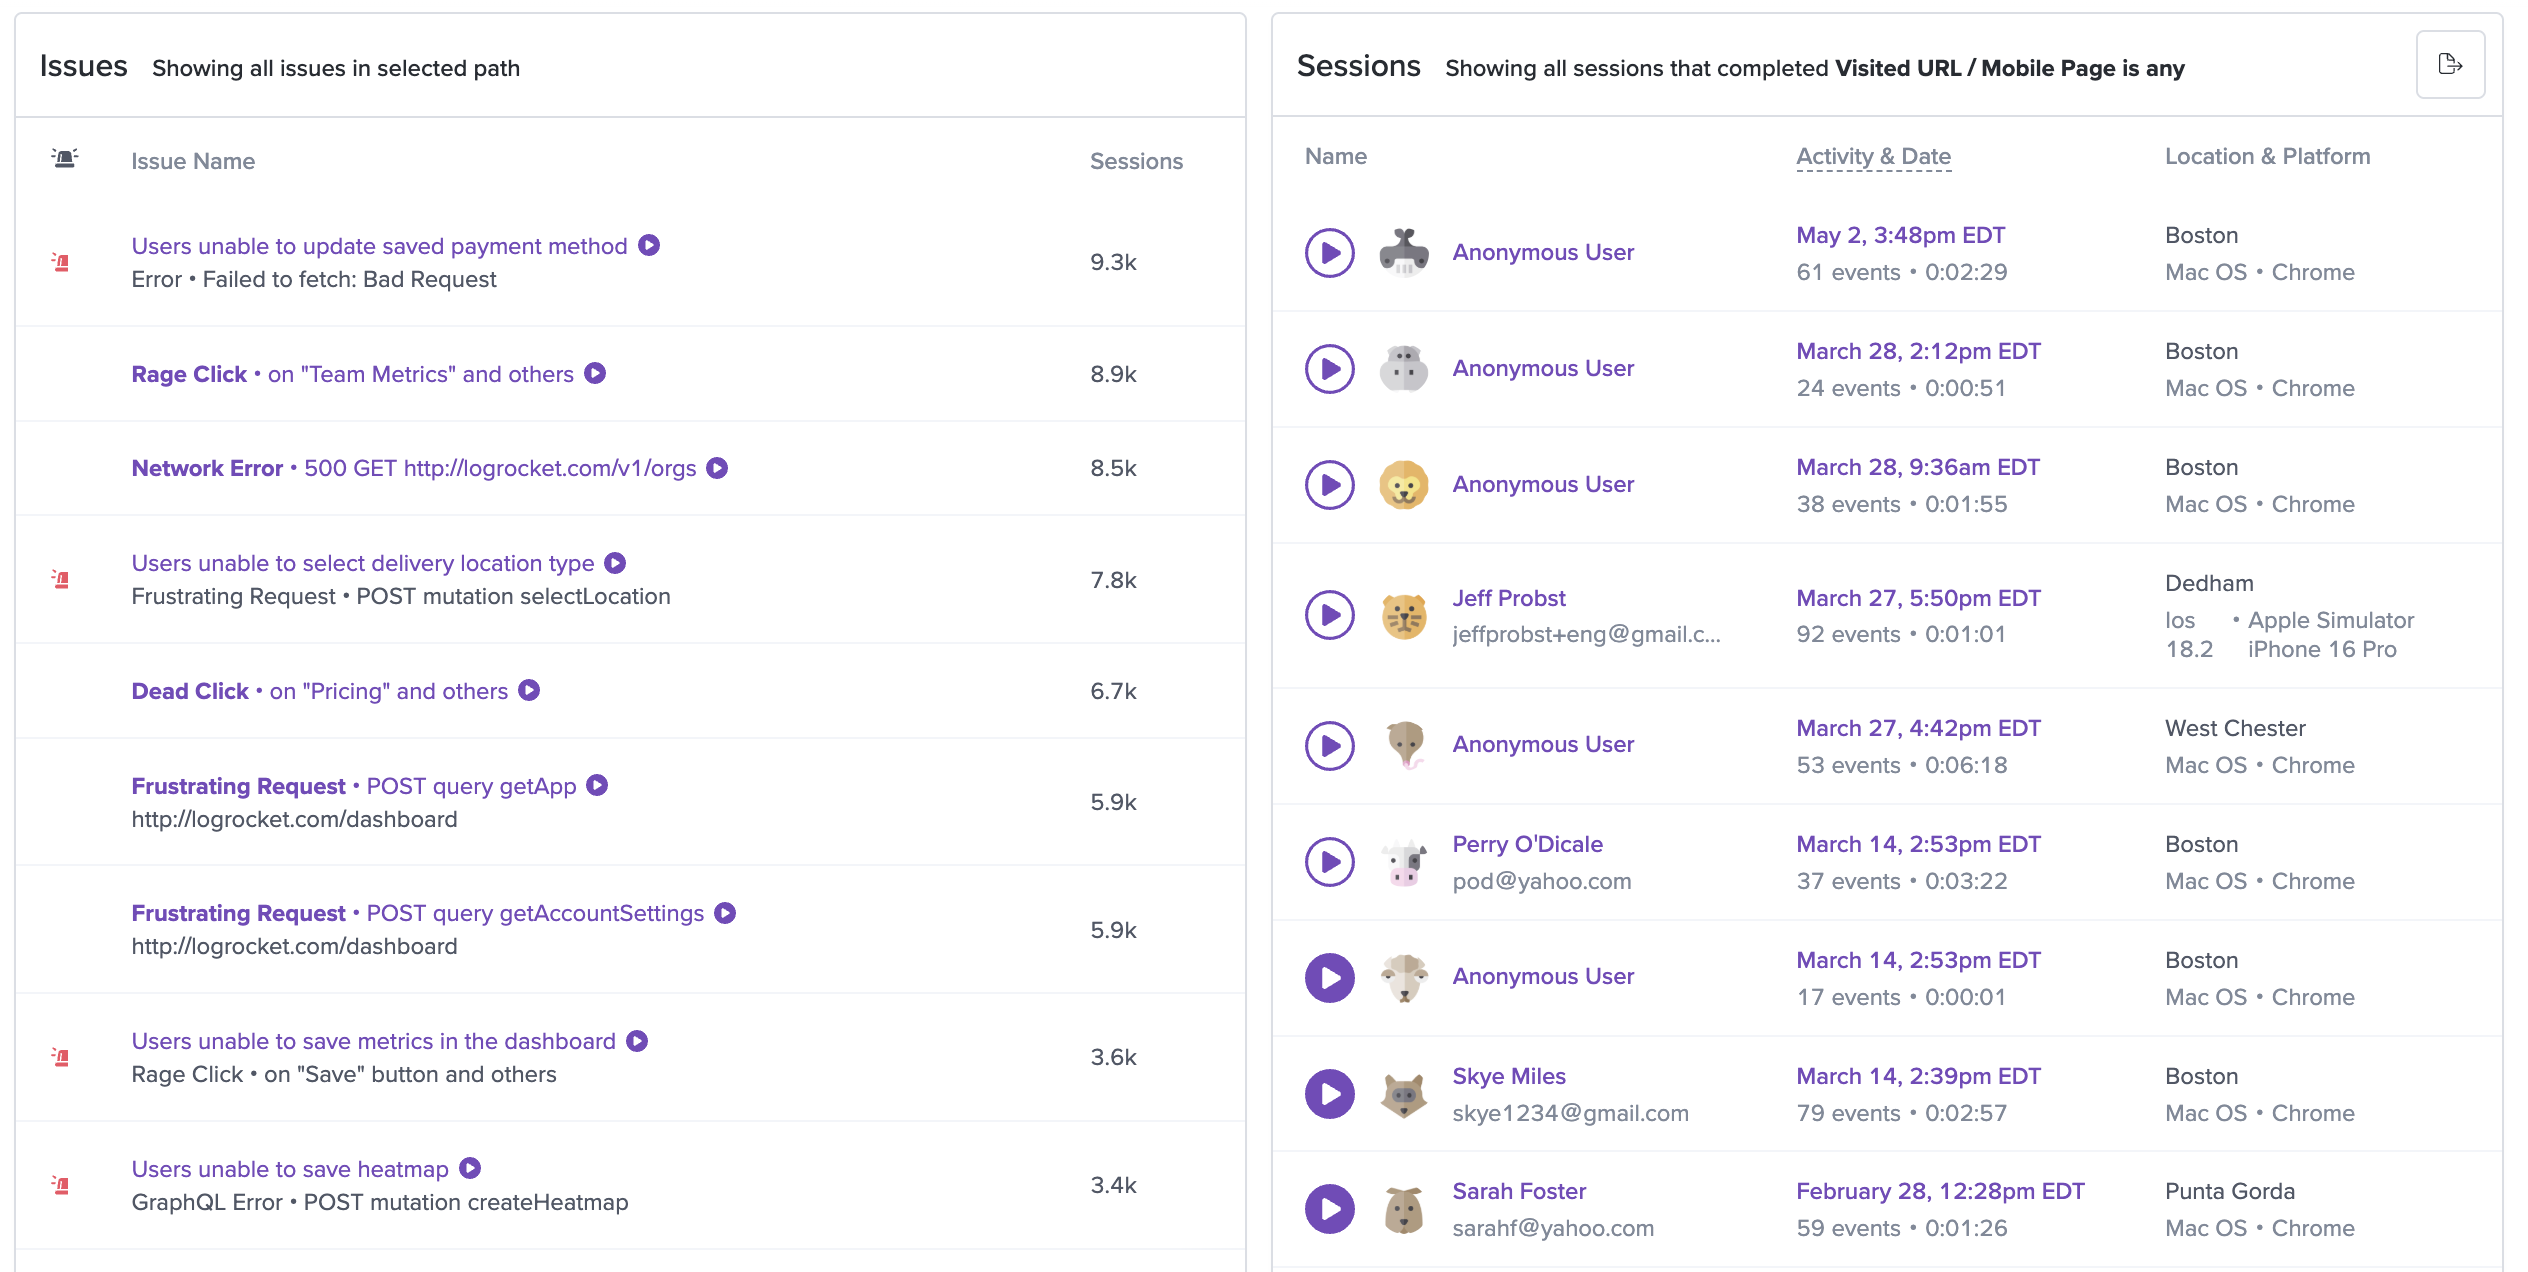
Below the chart you will also see a table of issues that are affecting sessions within the entire chart. If you select a specific path, you'll see issues specific to that path.
Updated 11 months ago