

Scrollmaps
Overview
In addition to click and heat maps, LogRocket provides scroll maps. These provide information about how far users are scrolling down on a particular page, which can be helpful in making UX and design decisions about the layout of information.
Configuration
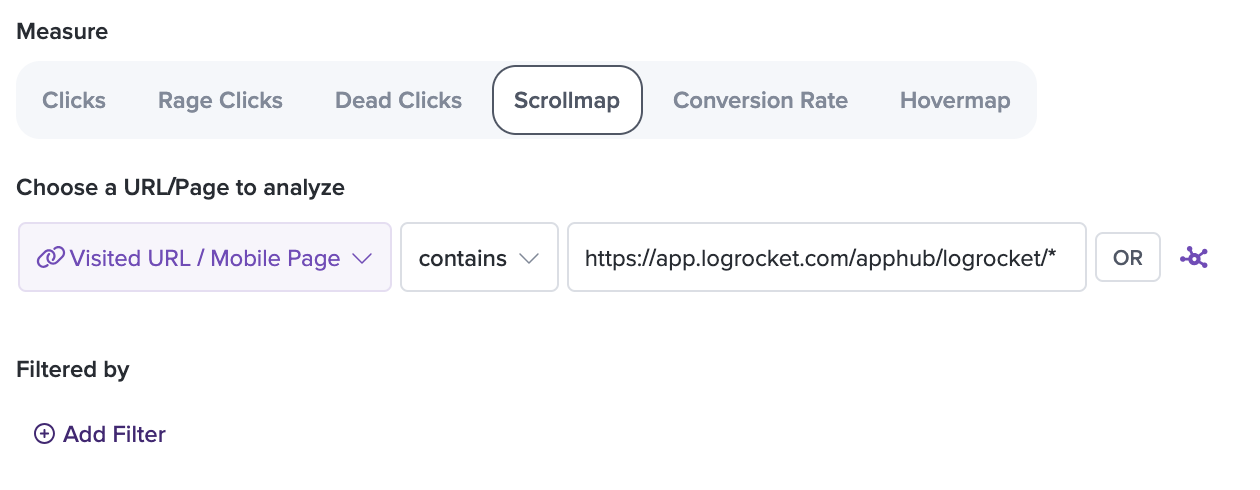
You can build a Scrollmap within the Metrics tab. Choose the page that you want to see the heatmap for by entering it in the first input box as the URL definition, or by creating a heatmap from a specific session recording (see Heatmaps for details).
You will notice a colored overlay placed on the heatmap view. These colors indicate how many users saw a specific part of the page, with the legend in the panel on the right.

You can scroll within the heatmap itself. You can also move the bar that indicates specifically the number of users who reached a part of the page.
The panel on the right also includes a quick, at-a-glance summary of user behavior insights for the current page.
Filtered sessions and devicesThe numbers for this data are pulled from the number of sessions within your current filter from the same type of device that interacted with this page, so they may not necessarily represent the entirety of visitors to your application who visited this page.
For example, if you are watching session playback for a user on a mobile device, the numbers you will see are reflective of the number of sessions within the filter who were also on a mobile device.
Updated 11 months ago