

Hovermaps
Overview
Hovermaps allow you to see where users were most commonly hovering their mouse on a specific page.
Metrics View
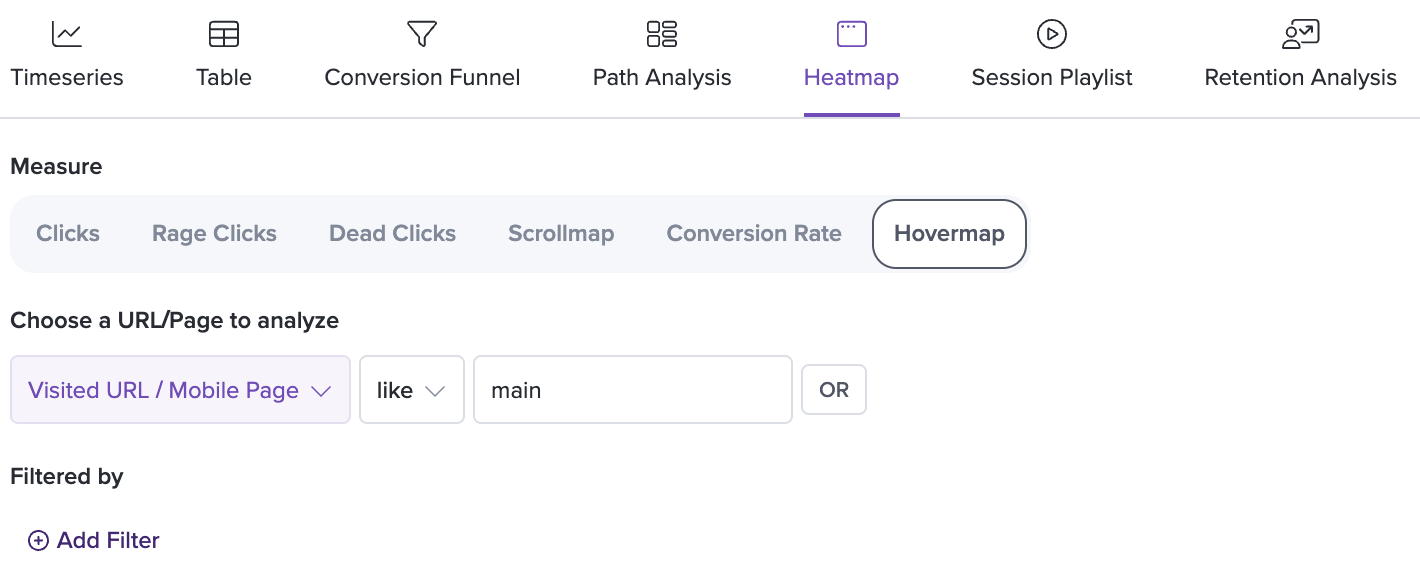
Similar to the other Heatmap types, you can create a Hovermap within the Metrics pane by adding a chart and selecting a Metric type of Heatmap. Then, you can specify the URL you want to see the Hovermap for. For heatmap type, select 'Hovermap'.
After you save, you'll be taken to the detail view of the hovermap.
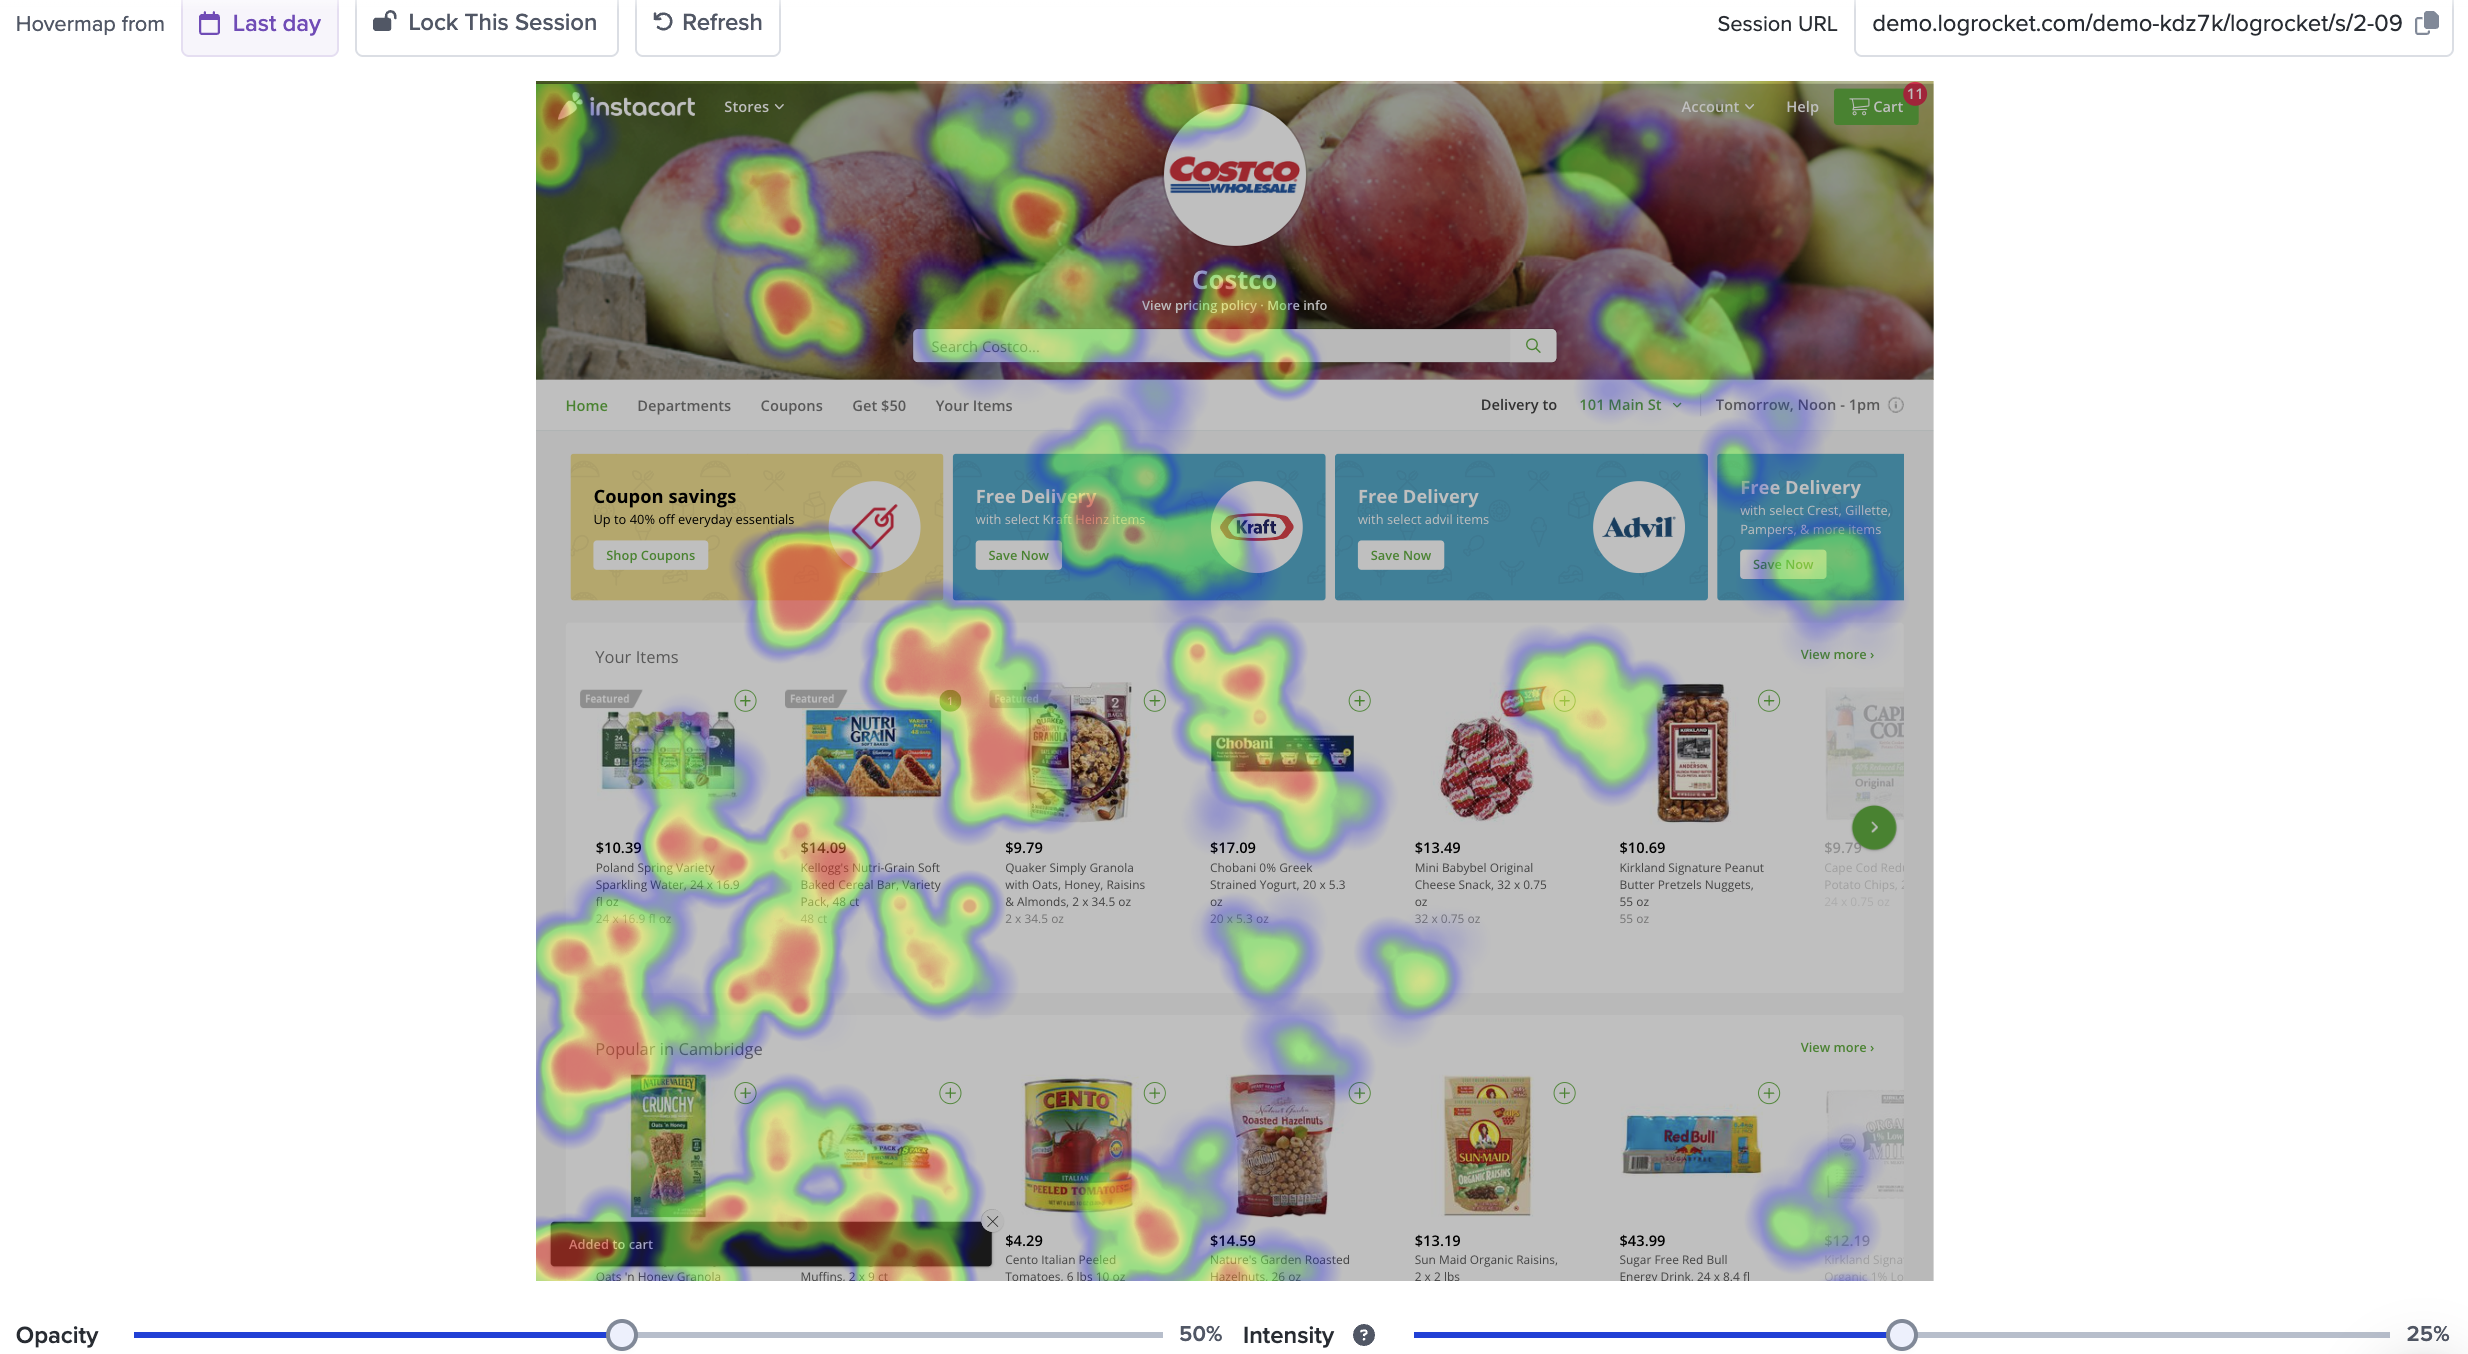
You'll see an image of the selected page overlayed with a gradient indicating where users hovered their mouse. This is based on aggregate data of all desktop sessions that have visited the specified URL as well as that match any filters you have set.
The redder a section of the page is, the more time users have spent hovering their mouse over that particular part.
Below the image, you'll see a list of sessions that have visited the specified page and match any filters you've applied. You can view these sessions to get a sense of how users are interacting with the page.
Session Playback View
LogRocket provides hovermaps as part of session replay. These show you the parts of your page that your users are clicking on most frequently.
To view the hovermap for a specific page, you should be in the session playback part of the application. Find the page whose click map you would like to view and pause the playback. In the top-right corner, click the Heatmap tab and then click 'Hovermap'.
How long does a user need to hover for the interaction to be tracked?This is intended to capture most hovers and movements. We track any hovers that have been on any part of the page for longer than 100ms.
You can use the Opacity and Intensity sliders to adjust the view of the hovermap.
Updated 11 months ago