

Retention Analysis
Overview
Retention Analysis allows you to visualize return user behavior over time and across multiple sessions to help drive product adoption. You are able to track completion of a desired ‘return event’ at times after a specific ‘start event’ has been triggered, in order to help you understand how users are interacting with your product across multiple sessions.
This can help answer questions like ‘After creating a new account, how often are my users completing a key action?’ and ‘How many users are still active after a month?’.
If you have both a web and mobile app and the sessions are in the same LogRocket Project, it can also answer the question "How many users create and account on our website, and then login on our mobile app?" If these sessions are in separate projects, this information could still be analyzed by employing a custom user trait.
Creating a retention analysis
Click ‘Add Chart’ in the top right-hand corner either on a Dashboard or from the Metrics page and select ‘Retention Analysis’ as the chart type.
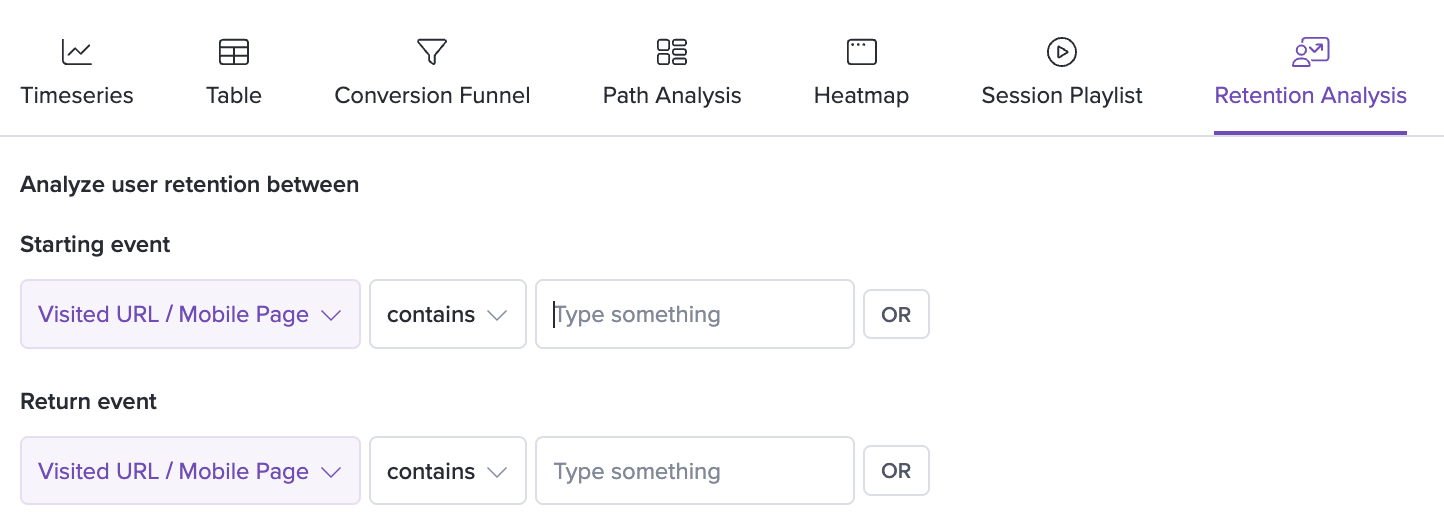
You will see configuration options prompting you to enter a ‘Start Event’ and a ‘Return Event’. Typically the Start Event is some sort of one-time activation event but you can select from any action that makes sense for your application. The Return Event can be an action that you know makes users stickier and that they are completing over time.
Please note that this chart type currently offers a limited selection of filters!
Interpreting your retention analysis
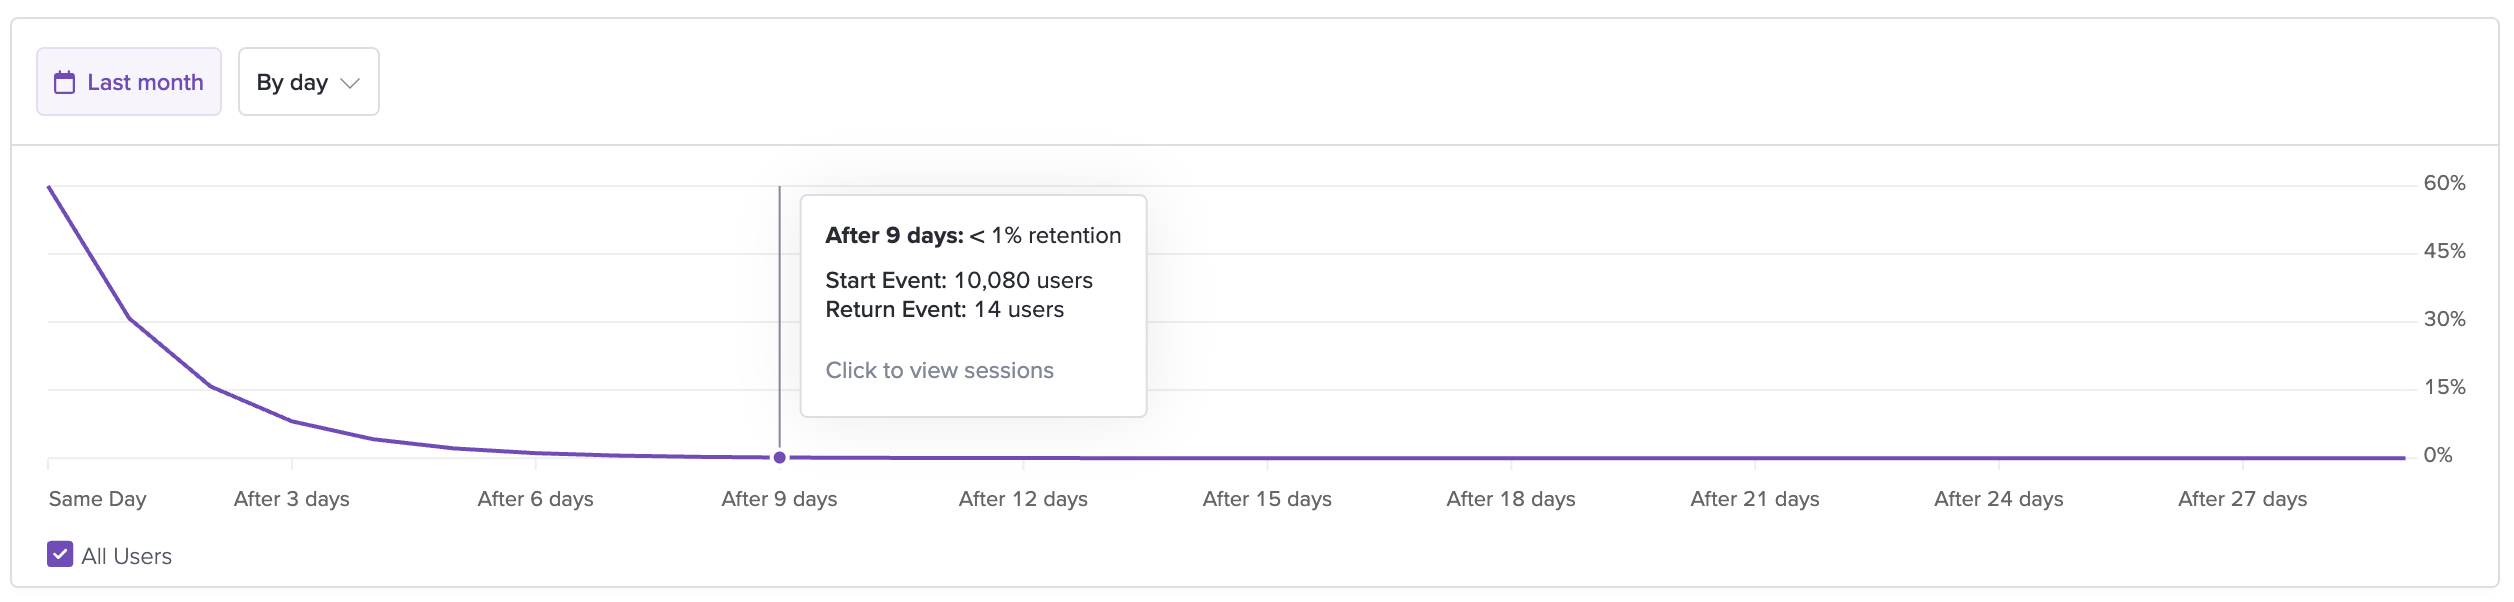
The retention analysis displays the percentage of users who have completed the Return Event on a specific day after completing the Start Event on Day 0. For example, you can see that the value on Day 7 of this chart is <1%. This means that <1% of users have come back to complete the Return Event seven days after completing the Start Event.
You can use the time range dropdown in the top right of the chart view to adjust the time range you are looking at.
Note that the retention analysis module only counts the first time a user completes the start event in the specified window.
Please note that the time range does not represented exact calendar dates and instead is a cumulative number that looks at all users who completed the Start Event at some point during the specified time range. The percentages are calculations based on the time elapsed between each user's first completion of the Start Event and any completion of the Return Event.
Session List
You can click into the chart and select to view sessions of users have completed or did not complete the Return Event on a particular day. The session list appears below the chart. Pairing the quantitative data in the chart with the qualitative data obtained from watching sessions can help provide insights on customers who are following desired behavioral patterns.
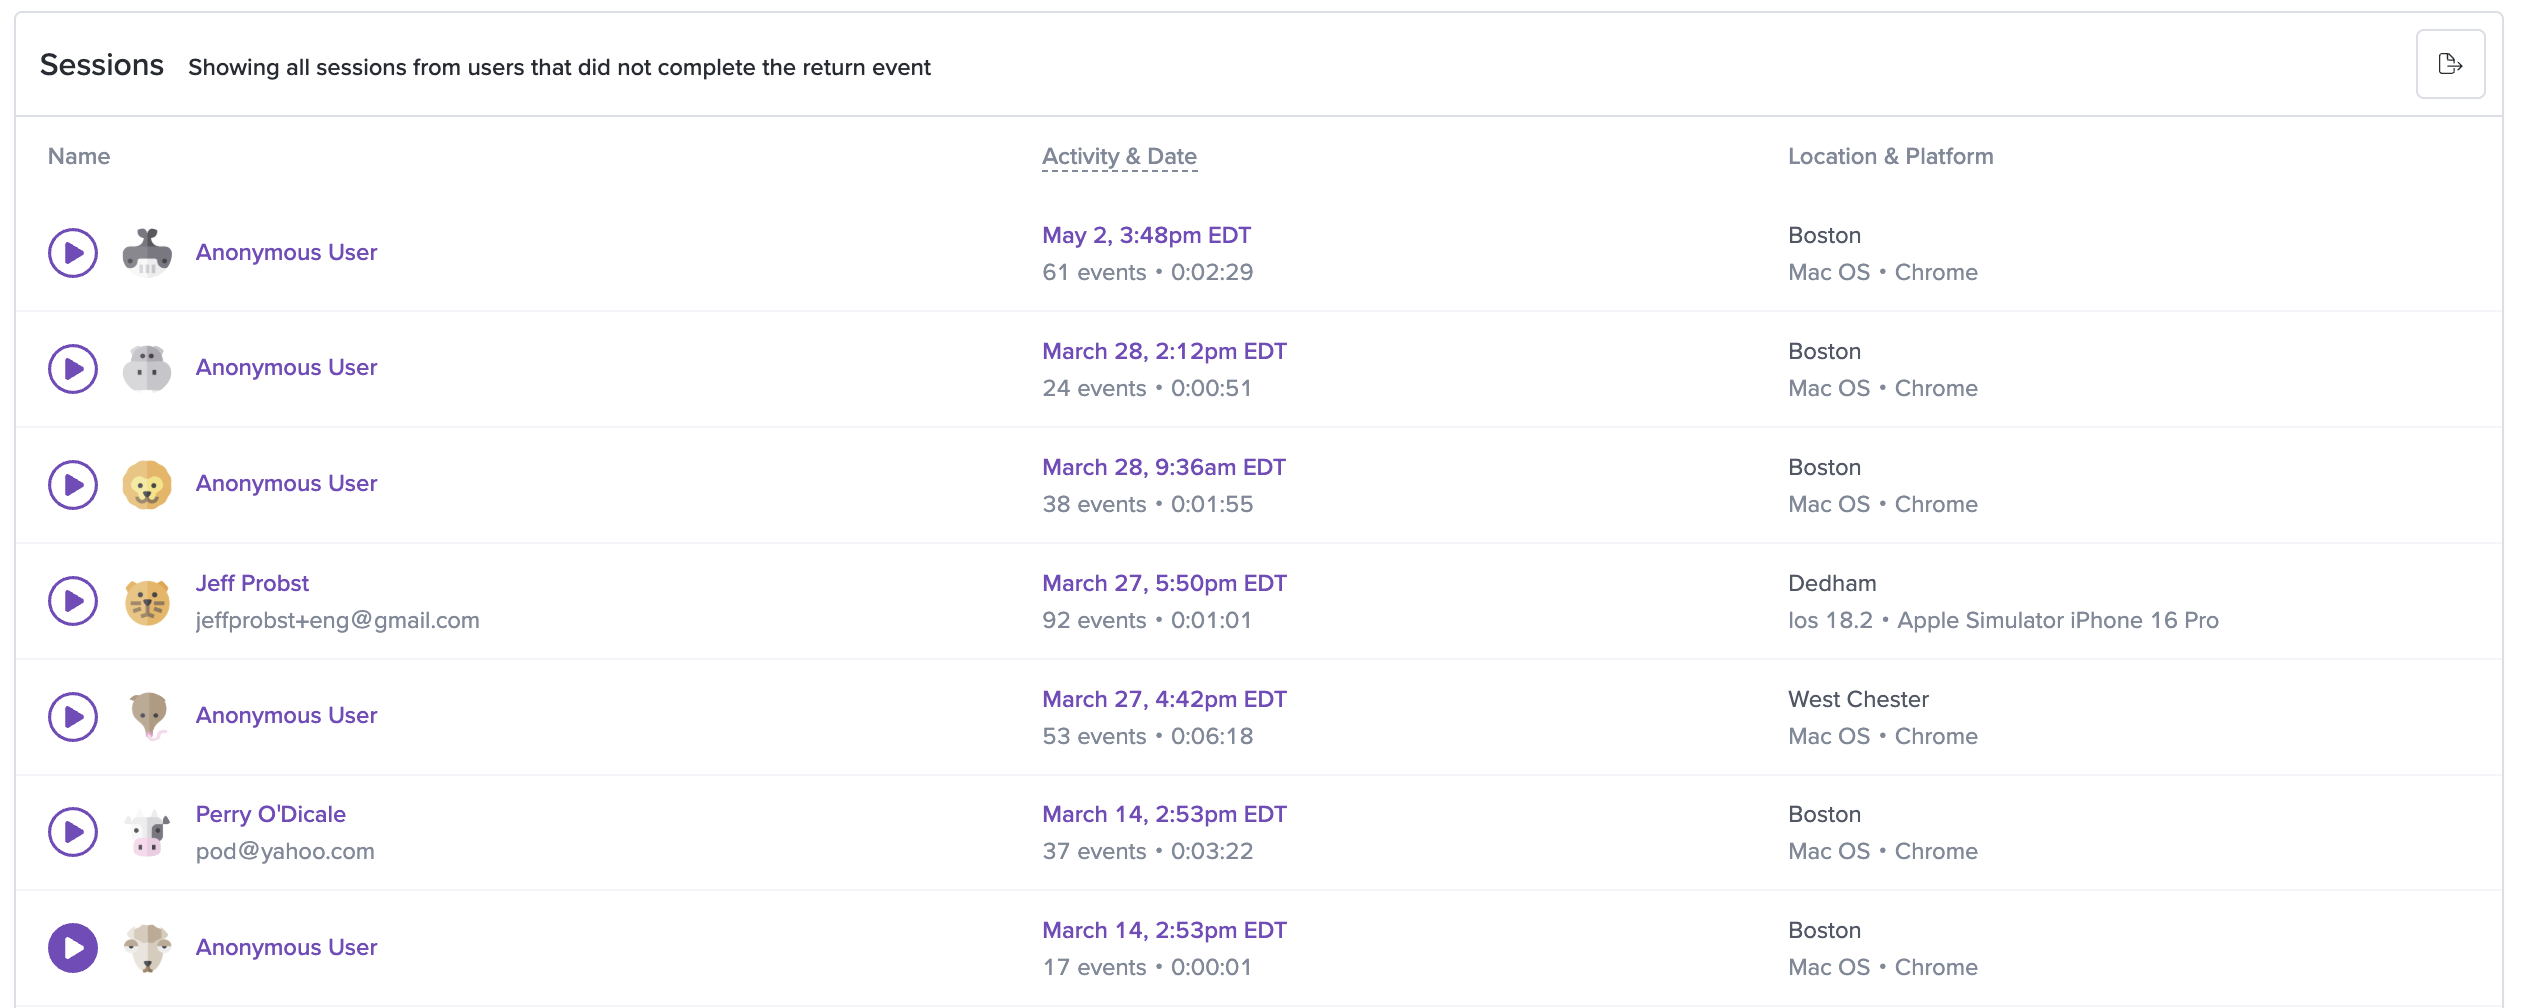
For this metric type, please note that our user attribution runs daily. If a user starts out as Anonymous and is later identified (i.e. logs in), the initial numbers may look slightly inaccurate. This should resolve after we fully process and attribute the activity to the correct user.
Updated 11 months ago