

Issues
Intelligently grouped problems impacting your users
A whole new Issues is coming soon!Our team is in the midst of rebuilding Issues with some exciting updates. This migration will occur in stages, so you may notice the Issues UI and feature set changing in the coming weeks before we've officially announced it. Our aim is to migrate all customers to this new Issues product without it impacting your current workflow, but if you have any concerns please reach out to [email protected].
Overview
The Issues page enables users to review all their frontend issues in one place and prioritize and learn more about the issues that are actually affecting the customer experience.
Currently, LogRocket's available issue types are Errors, Network Errors, Rage Clicks, Dead Clicks, Frustrating Network Requests, Error States, and Mobile Crashes, with more issue types planned in the future. You can toggle between these types or choose to view all with the dropdown in the upper righthand corner of the page.
Issue Types
- Errors - JavaScript (client-side), iOS, and Android errors. These errors may or may not directly impact the UI.
- Network Errors - Failed network requests and GraphQL errors. These errors may or may not directly impact the UI.
- Rage Clicks - Occur when a user clicks repeatedly in frustration on an element.
- Dead Clicks - Occur when a user clicks on an interactive element (button, link, etc), but the click had no visible effect (ie. a DOM change).
- Frustrating Network Requests - Compound events where a user shows impatient mouse actions during a particularly long network request.
- Error States - Triggered by the occurrence of Element Visible Definitions that are designated as "error states".
- Mobile Crashes - Occur when an iOS or Android app crashes.
Issues are retained for 1 month from the last instance of an issue. So if an issue stops occurring, it is available for 1 month after the last time it occurs. Issues retention is independent of an organization's session retention.
Pro & Enterprise plan issue typesNetwork Error, Rage Click, Dead Click, Frustrating Network Request, Error State, and Mobile Crash issues are available for Pro and Enterprise plan customers only.
Severe Issues via Galileo AI
See the Severe Issues doc to learn more about AI-recommended issues based on detection of significant user impact, with natural language descriptions.
Features
Features are currently in 🧪 Private Beta
Features are AI-generated product areas that help identify where an Issue is occurring within your application. They appear as tags on each Issue in the Issues list and on the Issue Detail page, so you can quickly see which part of your product an Issue impacts—for example, Product Listing, Checkout, or Shopping Cart—without reading through stack traces or session replays.
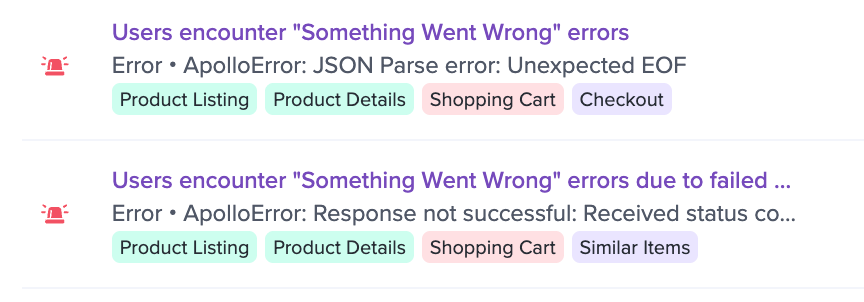
Features appear as tags on each Issue
How Features are generated
Features are generated automatically by Galileo AI. Galileo watches sessions across your application, identifies the distinct product areas users interact with, and generates a Feature for each one along with a description. This generation happens once per app, so you start with a complete set of Features without any manual setup.
Severe Issues onlyOnly Severe Issues are assigned a Feature label. Non-severe issues will not display Feature tags.
Viewing and managing Features
You can view all of your app's Features under Data & Context > Features. Each Feature lists its name and the AI-generated description of the product area it represents.
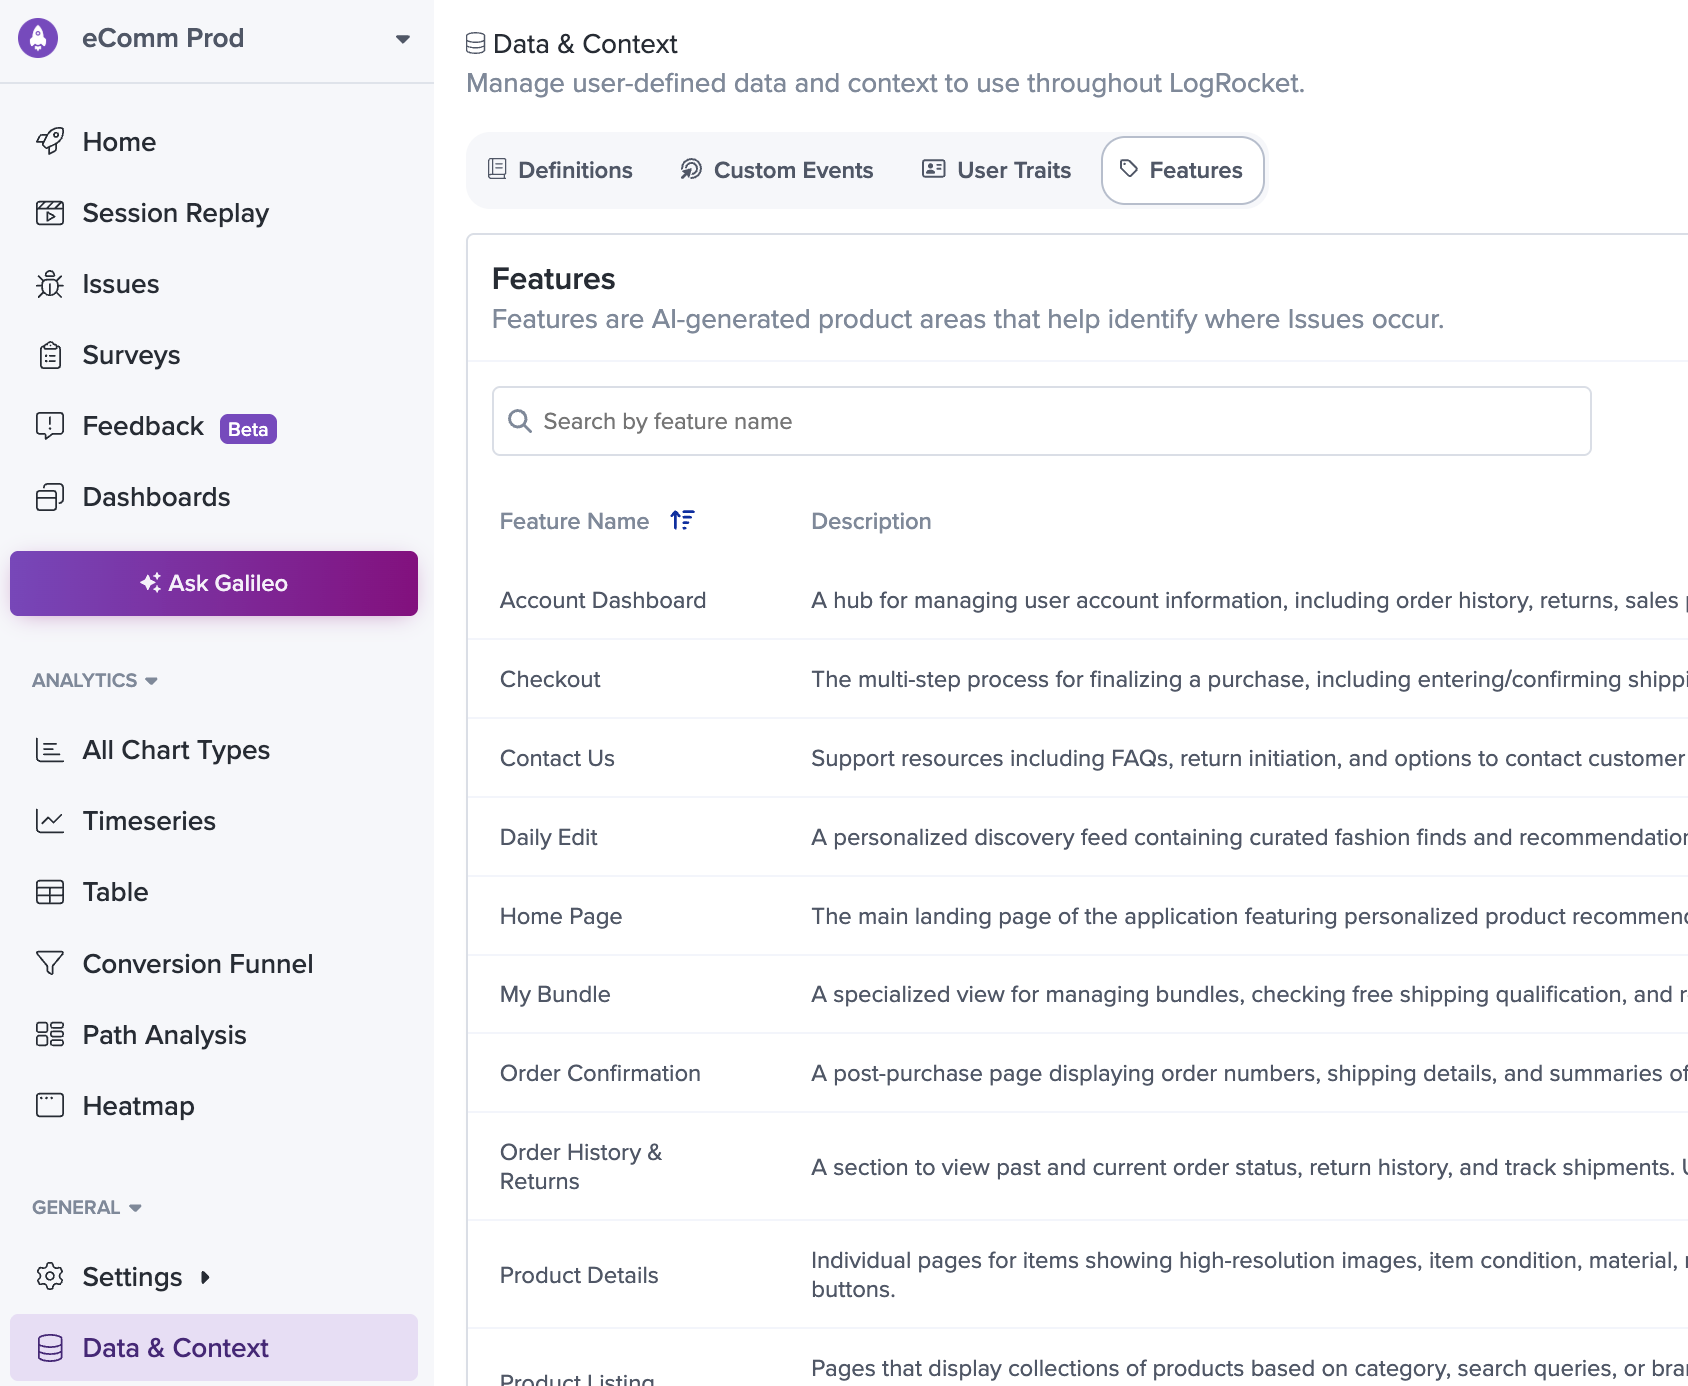
The Features view under Data & Context
Issues filters
Issues filters give users the ability to narrow the Issues list down to a specific subset of Issues more meaningful to their needs. Filters include:
- Issue Type
- Time Range
- Severity
- First Detected (in time range)
- Page Definition / URL
- Triage Status
- Platform
- Issue Title
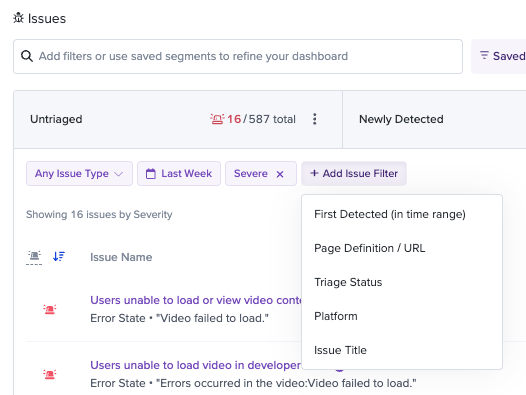
Issues filters
Issues Tabs
Users often have several groups of filters they go back to over and over again. To make this workflow easy, Issues have Tabs that let you save and name the groups of Issues filters that mean the most to you and your team. Issues comes pre-loaded with several Issues Tabs to get you started:
Issues Tabs
Issues list
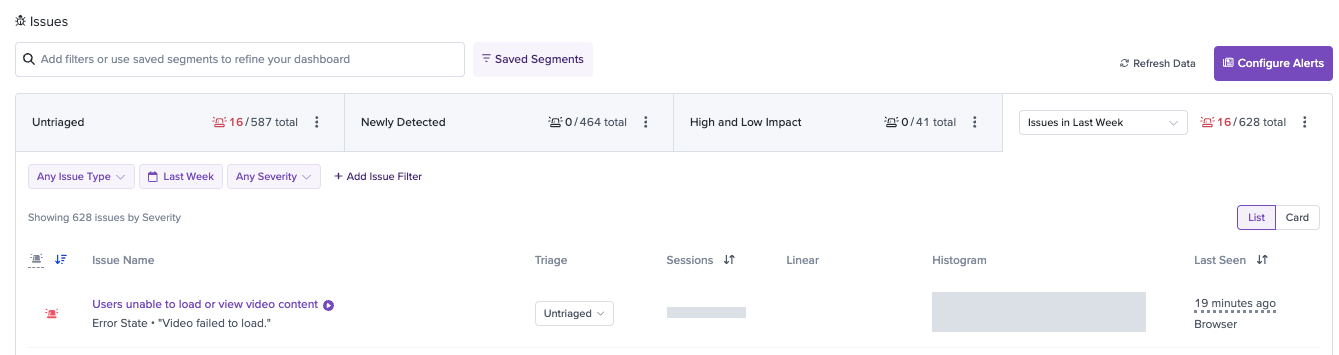
Below the Issues filters, you'll see a list of Issues from across your application, along with metadata about each issue.
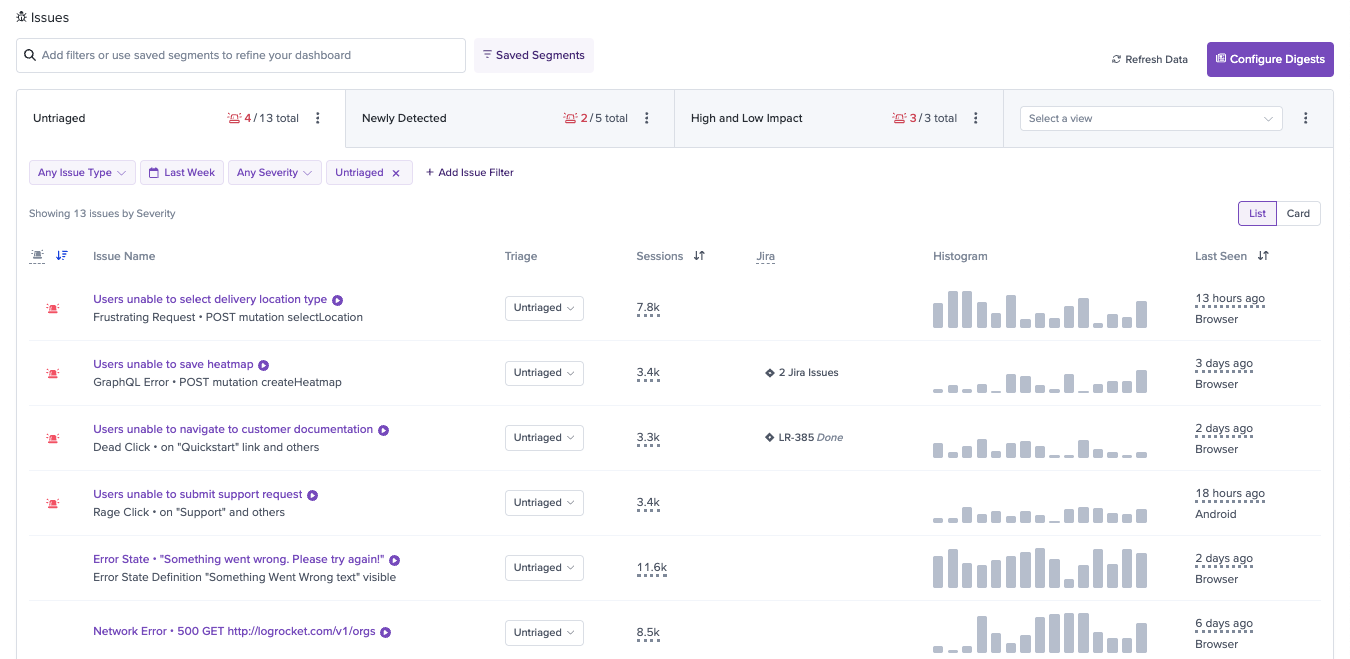
Issues list view
To the right of the issue title, you'll see the triage status of the issue, as well as a frequency histogram of its occurrences. At the end of the row, you'll see some additional metadata, including the number of sessions the specific issue has affected.
Card View
Screenshots can be see in the Card view of Issues. Toggle to "Card" in the top right corner of the Issues list.
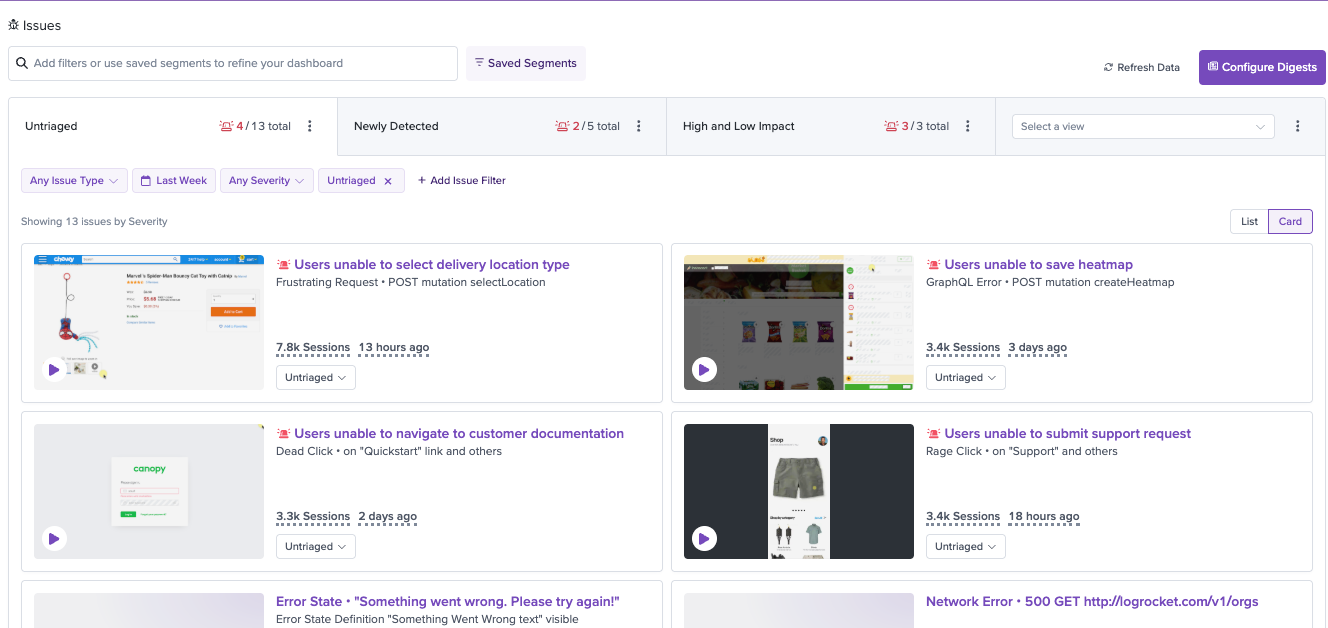
Issues Card view
Triage status
Triage status gives users the ability to categorize, with discretion, the impact of issues. The triage statuses are "Untriaged", "High Impact", "Low Impact", and "Ignored". To filter the list to issues of a specific triage status, click "Add Filter" in the Issues filters section and click "Triage Status". From here you can select one or more of the statuses to view.
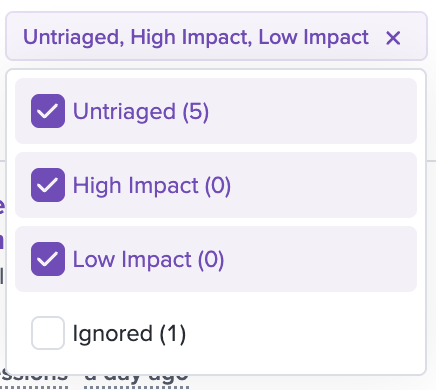
Triage status filter
Grouping issues
In order to categorize an issue directly from here, click the dropdown labeled Untriaged in the issue row and select whether the issue is High impact, Low impact, or should be Ignored completely.
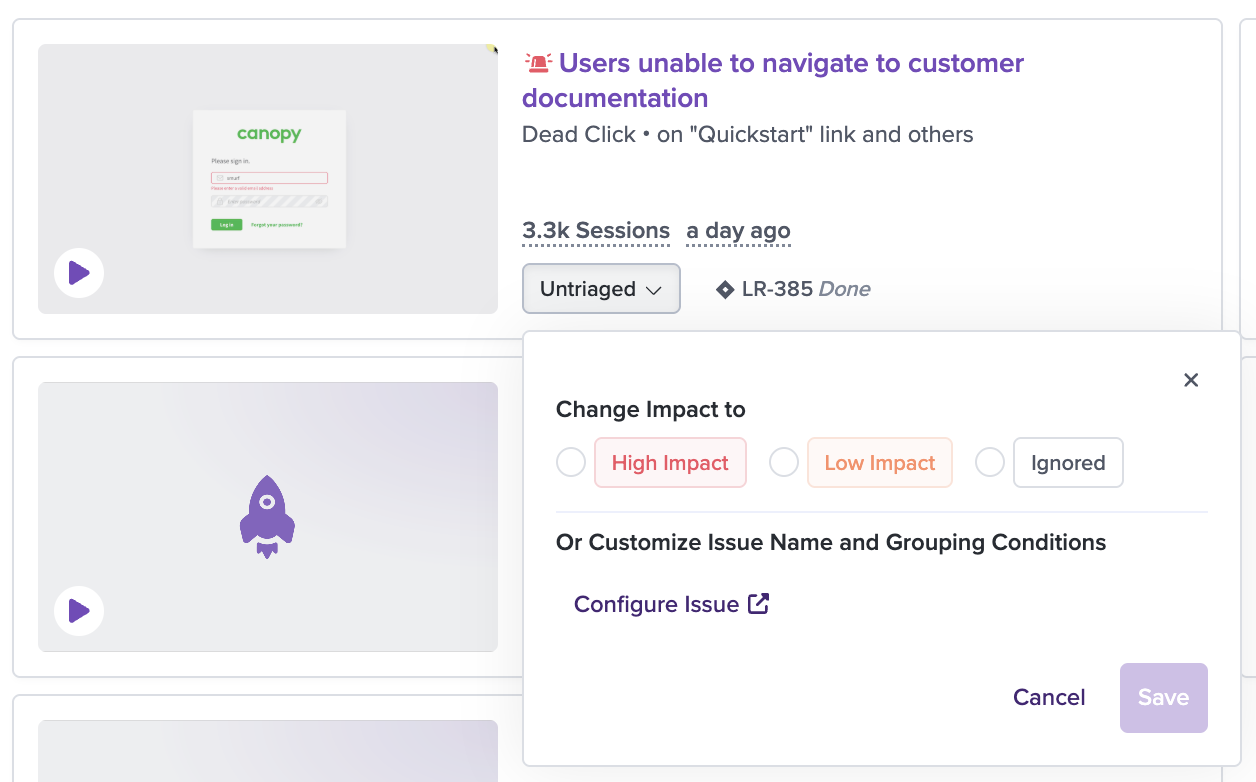
Issue triaging popover
You can also choose to open the Configure Issue modal. This allows you to assign the issue a custom name and also add custom rules to group issues together and assign them the same status. Setting custom issue group conditions can be done for Errors, Network Errors, and Frustrating Requests.
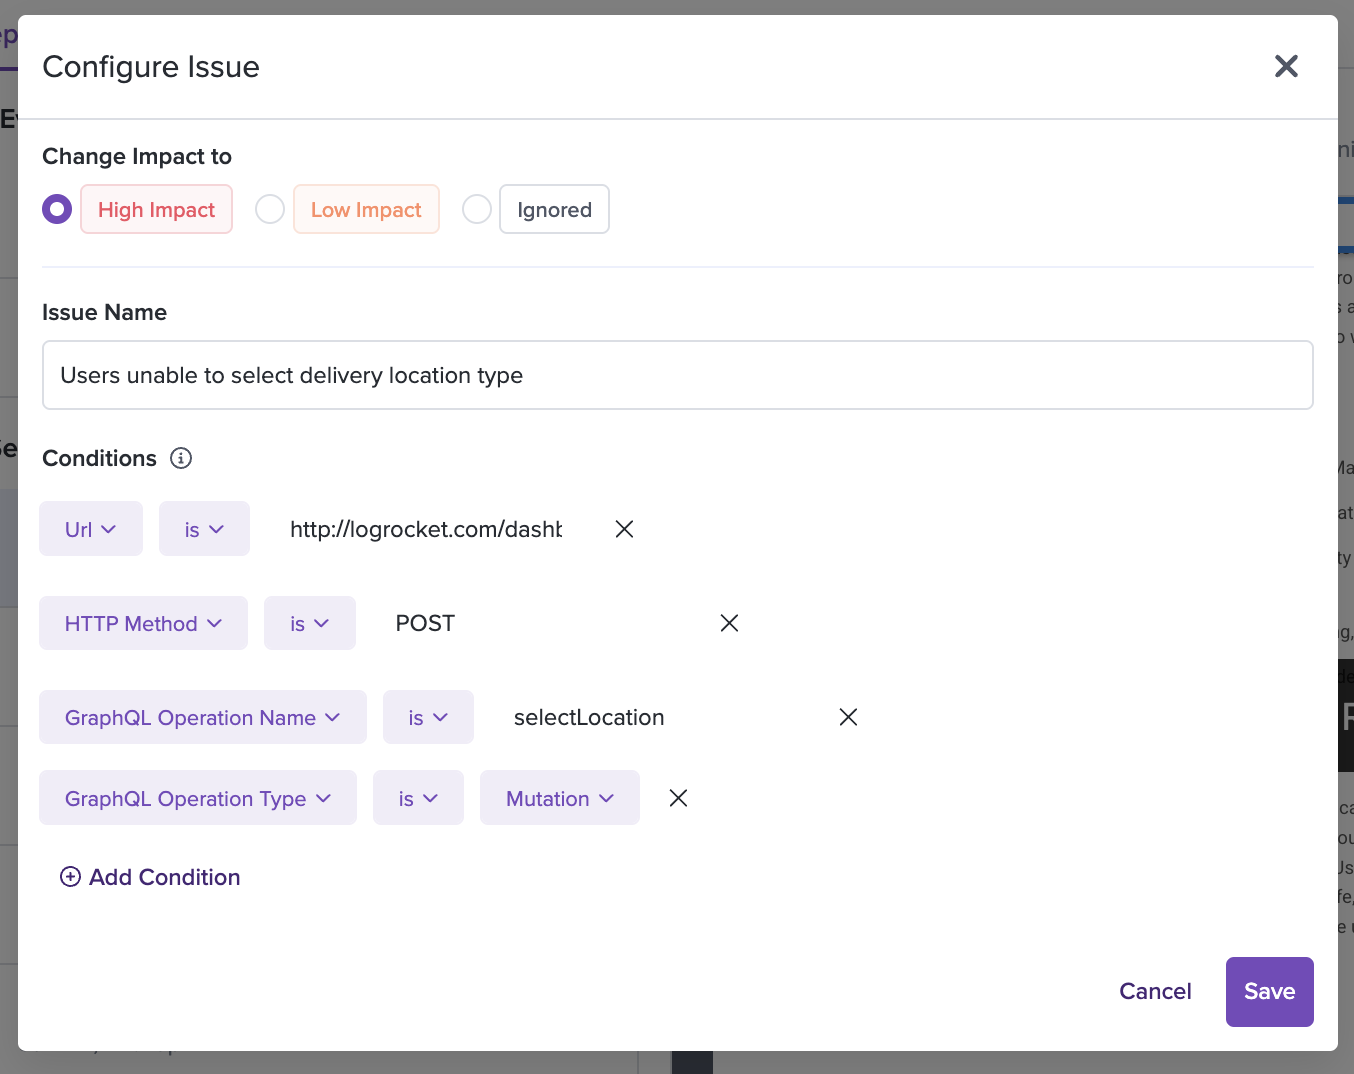
Configure Issue modal for updating impact score and issue grouping conditions
Any new issues that arise within your application and match any of these rules will be auto-categorized into the selected status.
You can also categorize and group issues directly from their Issue Detail page.
Grouping issues must be of the same typePlease note that you can currently only group issues of the same type. For example, you can create groups that contain different types of JavaScript exceptions as well as groups that bundle different types of Network Errors, but you cannot create a group containing both of these types.
Error State Issue Type
The Error State issue type groups instances where users receive a message indicating that something went wrong. This can include error pages, modals, or views. Error States are defined by the user for the each project in Definitions.
To enable Error State issues, on the Issues view click the Issue Types filter and click "Setup" next to the "Error States" option.
A Definitions side modal will open. Click "Add Definition" and create new "Element visible" definitions with the "Use as Error State" checkbox checked.
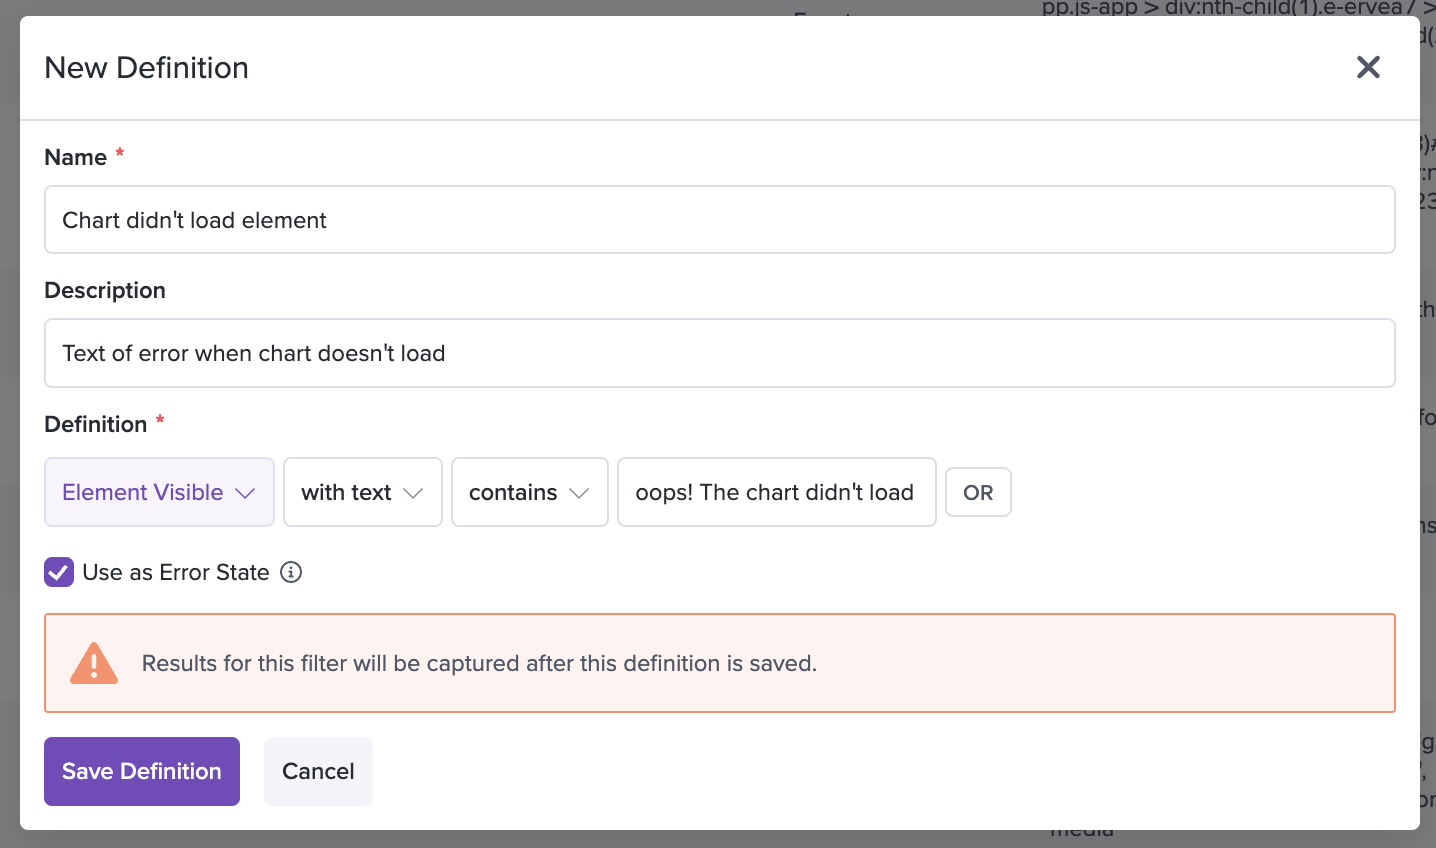
Chart failed to load error state, element visible definition
As you create these definitions, error state issues will begin to be recorded in LogRocket. Note: Element visible definitions are non-retroactive, meaning they will record events after being defined, but will not look back in time before their creation date. This means that once Error State definitions have been created, new Error State issues will start appearing from that point on, so you may need to check back in a few hours after creation to see the error states that users have hit.
Quickstart: Start out with default error state definitionsThe quickest way to get started with Error State issues is to let LogRocket create them for you!
Check out the Default Error State Definitions doc to see how to bootstrap default error state definitions.
Page Definitions / URL filter
In order to see issues that only occurred in specific areas of your app, use the "Page Definitions / URL" filter. Once Page Definitions are selected, issues listed will be ones that have occurred within those Page Definitions (on those specific URLs) in your app.
Definitions (using the "Visited URL" filter) are a shared feature of LogRocket and can be found in the main navigation. To add Definitions, either click the definitions icon to the right of the "URL / Mobile Page" input within the Page Definition / URL modal, or go to the "Definitions" page and add new Page Definitions.
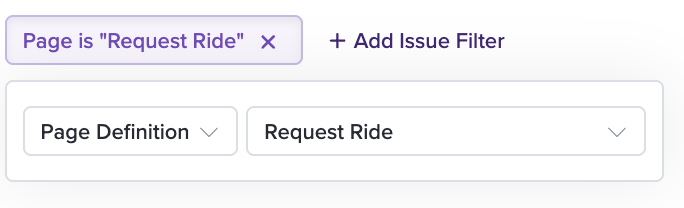
Definitions filter for Issues
First Detected filter
By default, issues listed have occurred any time within the selected time range. You can use the First Detected filter to identify issues that have occurred for the first time within the selected time range, but may have continued occurring afterwards. Note that the 1 month issues retention also applies to the First Detected filter, so the first occurrence of an issue is based on events within the past month.
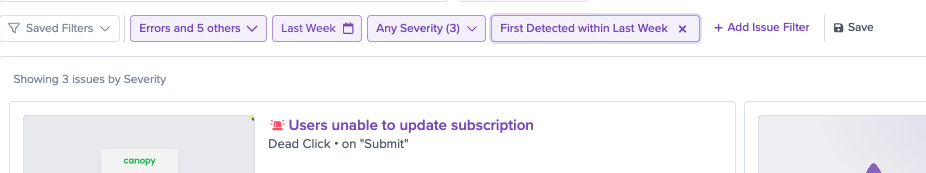
First seen filter for Issues
Platform filter
Each issue is comprised of events from a single platform - Browser, iOS, or Android. The Platform filter allows you narrow the scope of Issues to one of these platforms. Since React Native compiles to native code, apps that use the React Native SDK will find issues in the iOS and Android platforms.
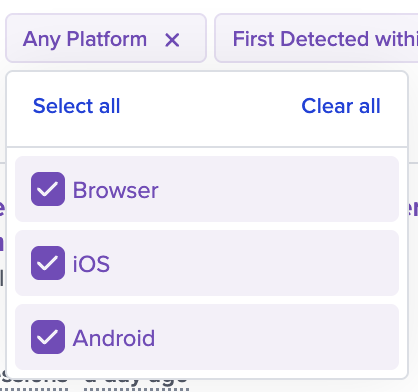
Platform filter for Issues: Browser, iOS, and Android
Issue Detail page
You can click through on an individual issue to view more detailed information about the issue, including a sample playback of a user encountering the issue within a session. This is designed to give you information to help you categorize the priority of the issue. For example, issues that block users within a critical sign-up or checkout flow may be deemed higher-priority than issues that occur silently with no real user impact.
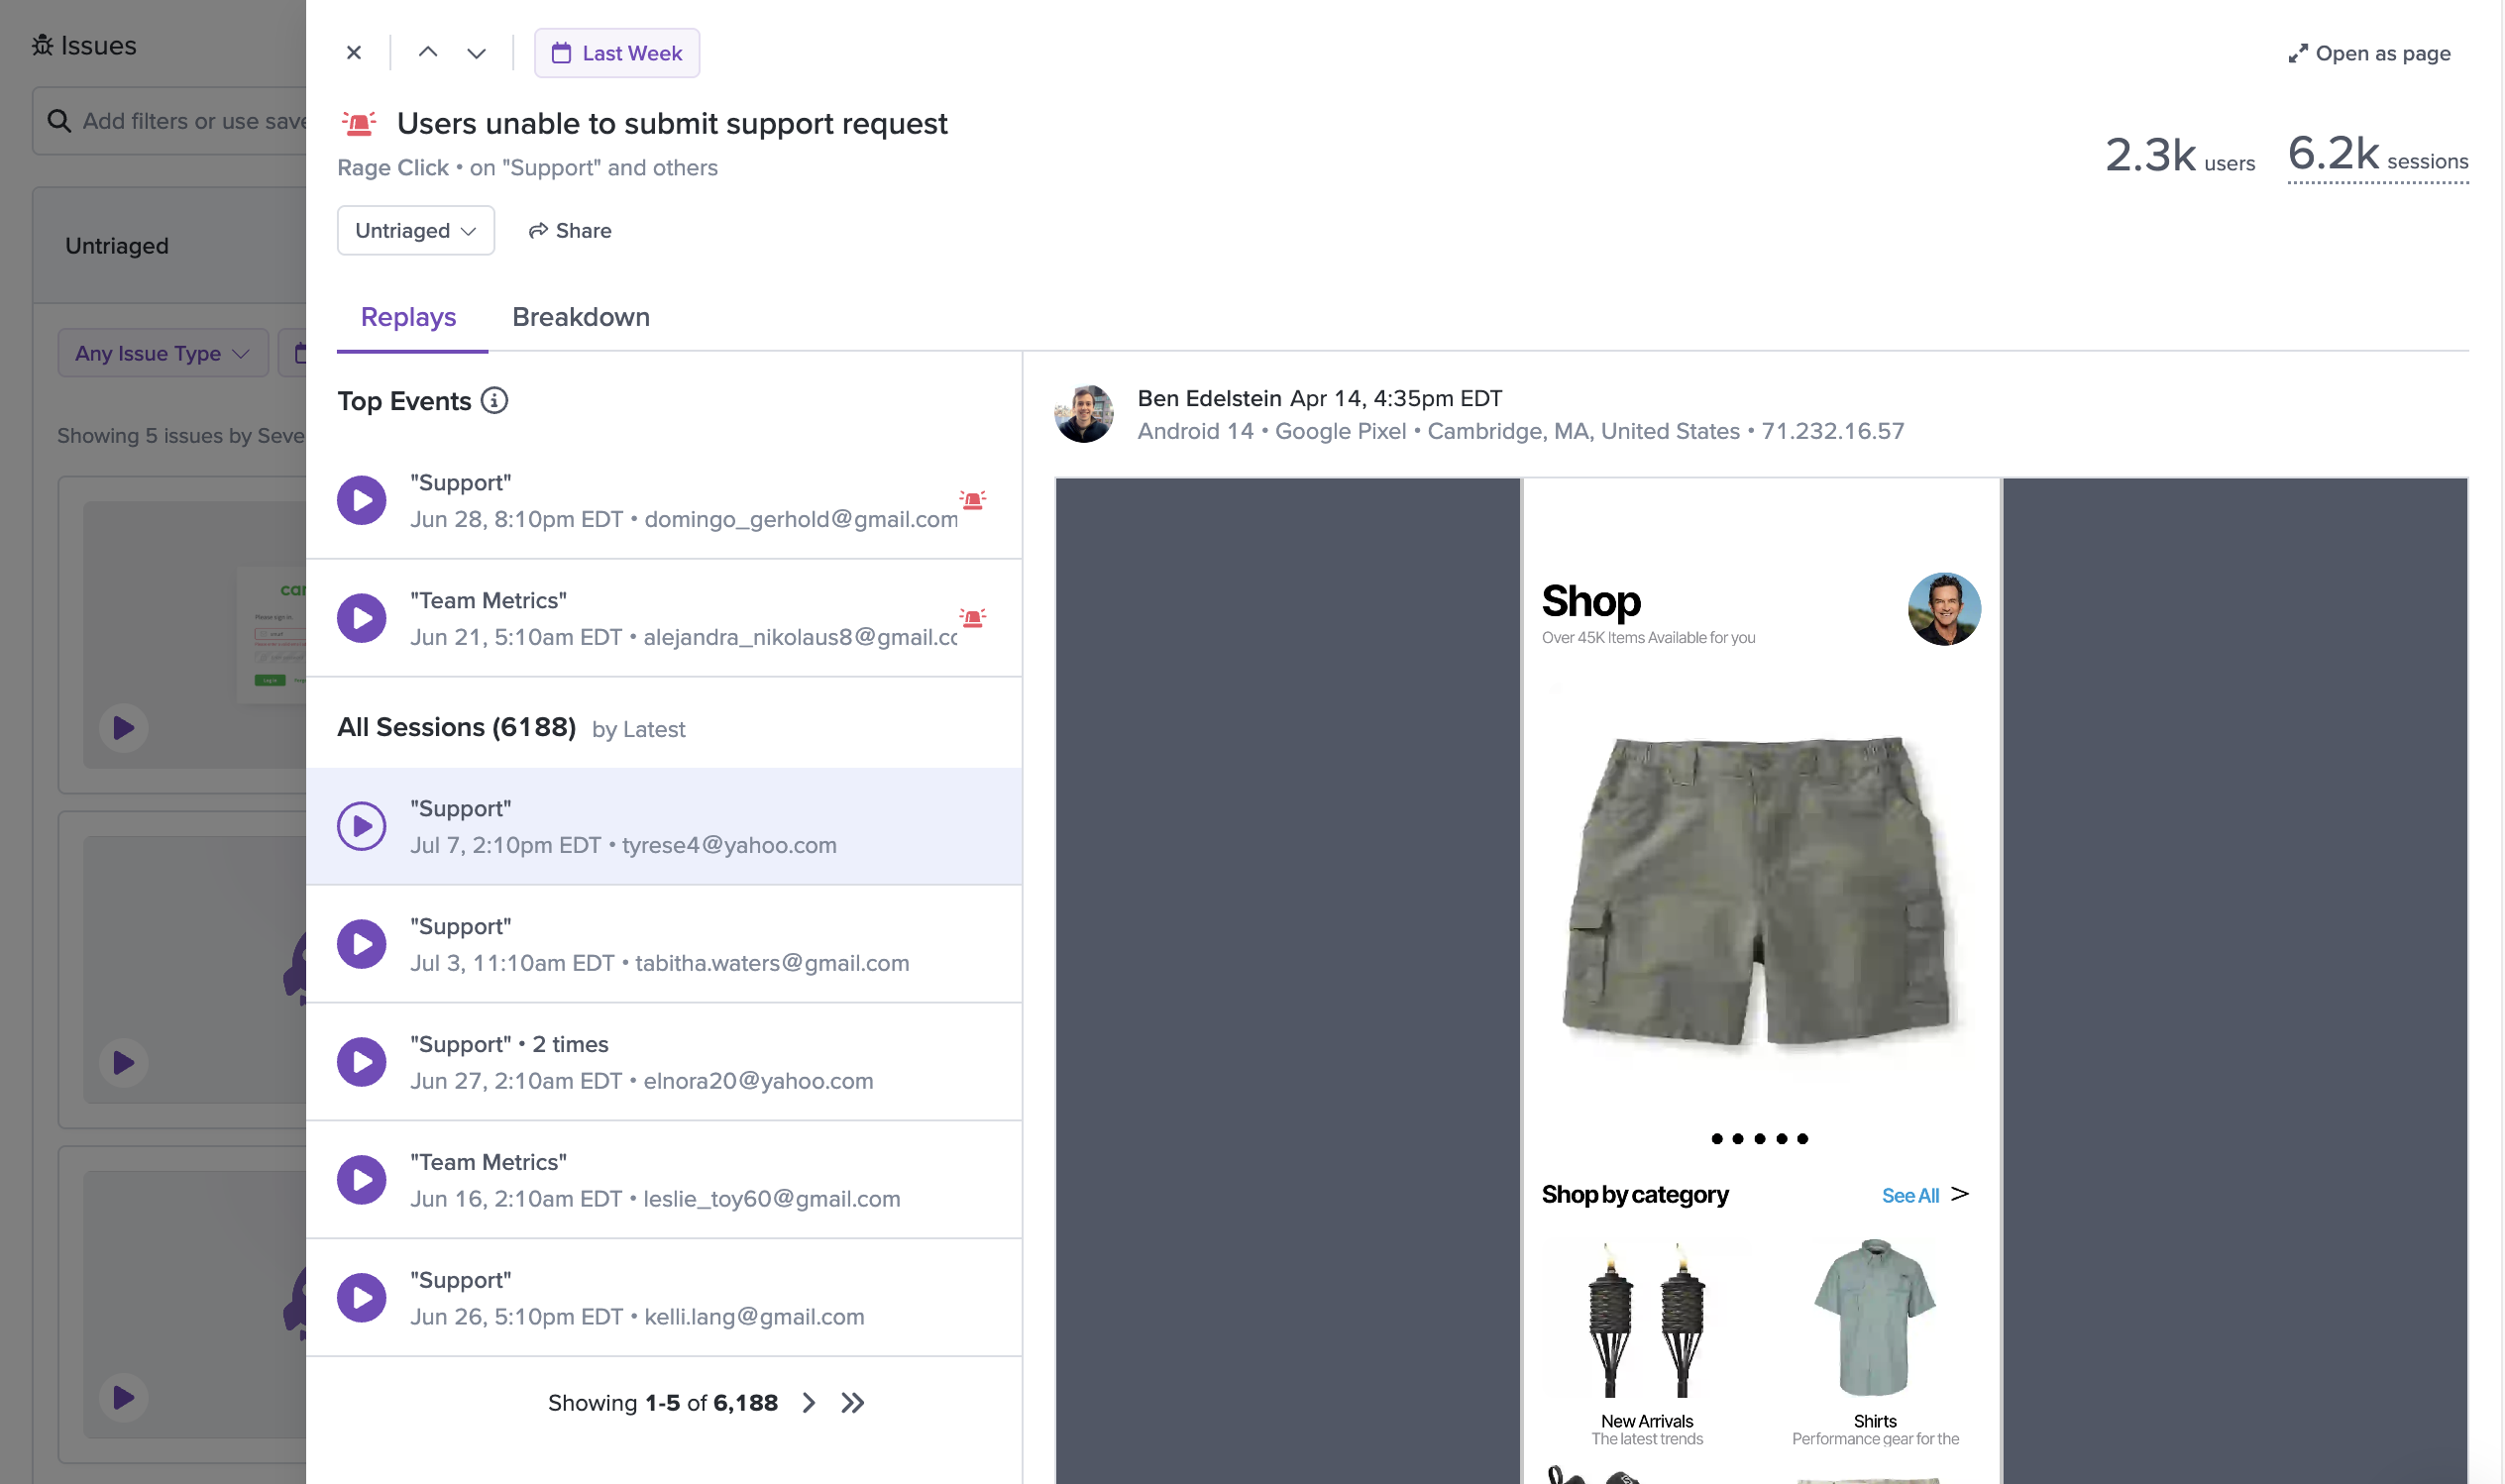
Below the playback is additional information related to the error. This includes stack traces if you have provided us with sourcemaps, and request and response information if the issue type is a network error.
The list to the left of the session playback shows the metadata associated with the specific session playback.
The 2nd tab, "Breakdown", reveals cumulative information about the issue, such as frequency of occurrence, most common browser, and number of users and sessions impacted.
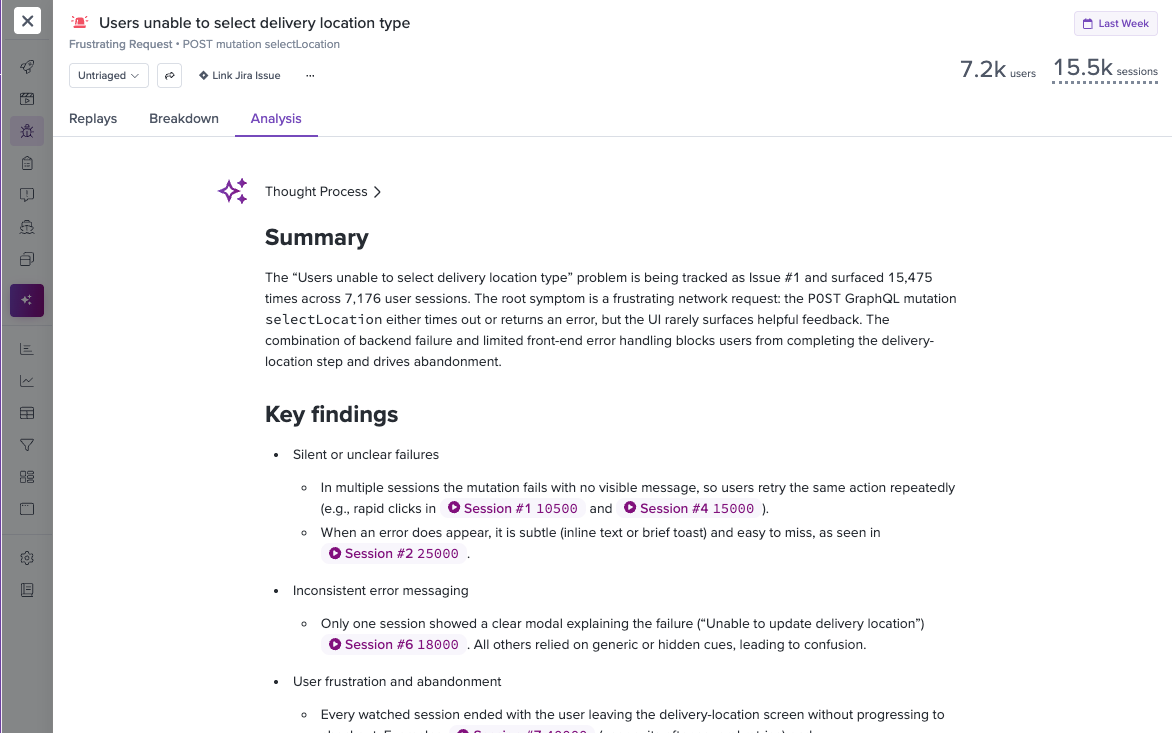
Issue Analyzer
Issue Analyzer is currently in Beta
Issue Analyzer is a Galileo AI-powered feature that automatically analyzes your issues to save you time and provide deeper insights into user impact and root causes. Instead of manually reviewing multiple session replays to understand an issue's true impact, Issue Analyzer does this work for you by intelligently analyzing patterns across all related sessions.
What Issue Analyzer Does
Issue Analyzer automatically:
- Analyzes user impact: Determines whether the issue actually affects the user experience or occurs silently in the background
- Identifies root causes: Examines session replays to pinpoint the underlying cause of the issue
- Provides severity assessment: Evaluates how critical the issue is based on user behavior and outcomes
- Suggests next steps: Recommends specific areas for further investigation or immediate action (when available)
Key Benefits
- Time savings: Eliminates the need to manually review dozens of session replays to understand issue impact
- Consistent analysis: Provides objective assessment across all issues, removing guesswork from prioritization
- Actionable insights: Delivers specific, actionable recommendations rather than just identifying problems
- Better prioritization: Helps teams focus on issues that genuinely impact user experience
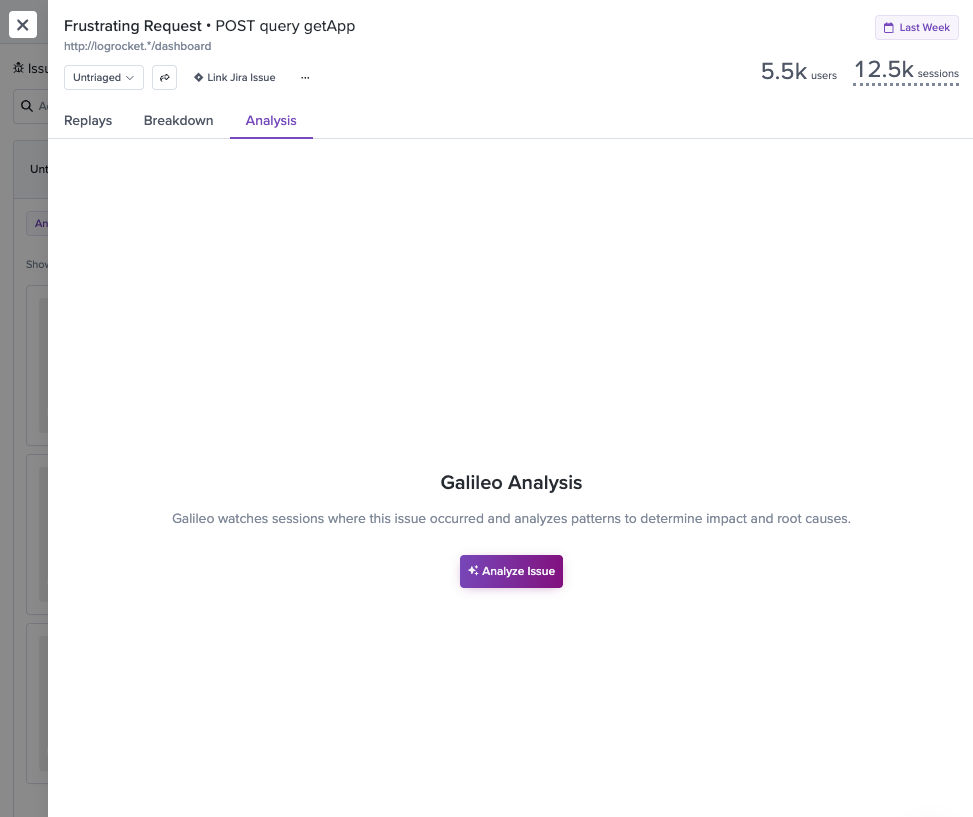
Availability
Currently available to all Pro/Enterprise customers. Look for the "Analysis" tab in the Issue Details view:
URL Grouping Configurations
Network Errors and Frustrating Network Request issue types have optional URL grouping configurations that can be adjusted in the Issues Settings view. This provides better visibility into the scope of issues in apps with subdomains or domain extensions that represent the same basic experience.
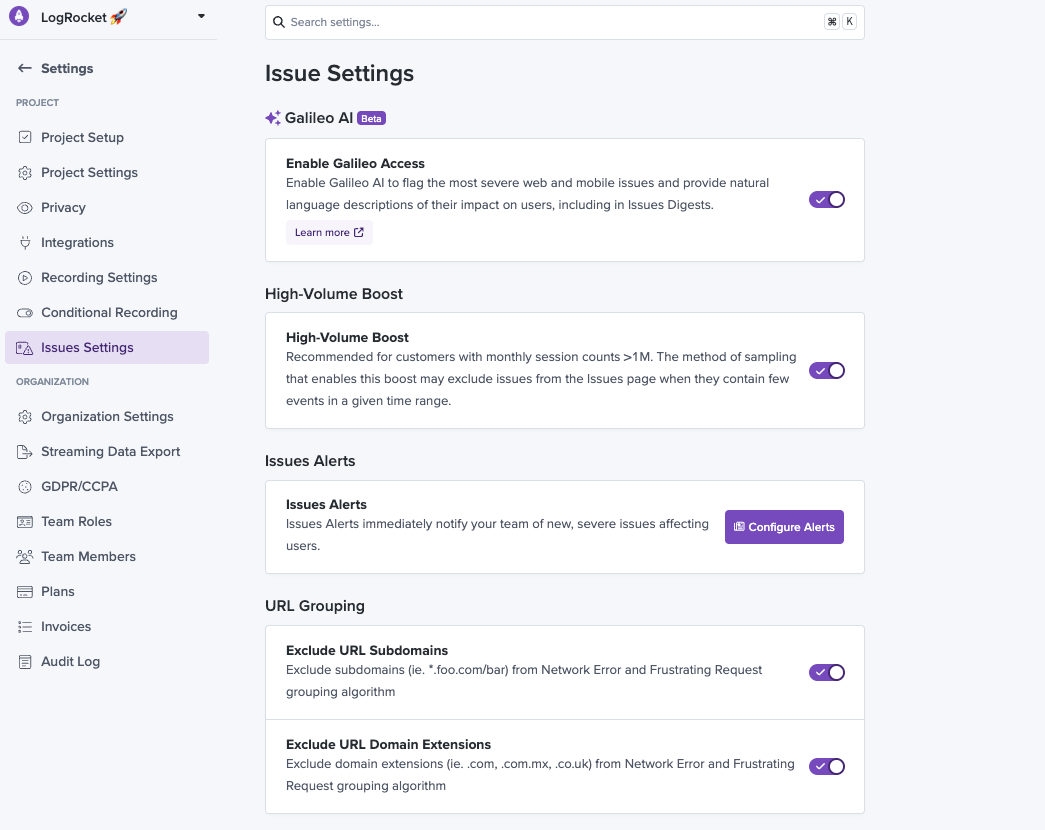
URL Grouping configs in Issues Settings
Exclude URL Subdomains should be enabled when an API's multiple subdomains represent the same basic API. For example, for apps that use account keys as subdomains, like customer1.app.com/foo/bar and customer2.app.com/foo/bar. This will group across subdomains: *.app.com/foo/bar for Network Errors and Frustrating Network Requests issues.
Exclude URL Domain Extensions should be enabled when an API uses multiple domain extensions that all represent the same basic API, such as app.com/foo/bar and app.co.uk/foo/bar. This will group across domain extensions: app.*/foo/bar for Network Errors and Frustrating Network Requests issues.
High-Volume Boost
For customers with >1M monthly sessions, enabling High-Volume Boost for Issues will increase the speed at which Issues load across the app. This configuration intelligently queries Issues in an optimized way especially tuned for customers who have higher counts of issue events. Note: this configuration is not recommended for users with <1M monthly sessions.
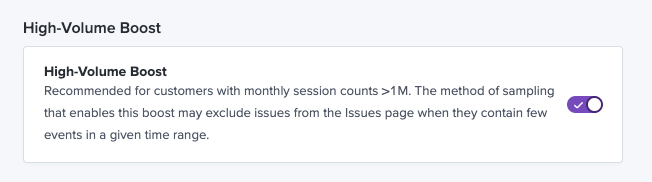
Issues setting for High-Volume Boost
Auto-dispatch Cursor agents
When enabled in Settings → Project → Issues Settings, LogRocket automatically launches a Cursor Cloud Agent whenever Galileo AI detects a new severe issue — sending the same Galileo-generated debug package used for manual dispatch and opening a pull request when the agent finishes.
Auto-dispatch requires Enable Galileo Access and a project-wide Cursor API key configured under Settings → Integrations → Coding Tools. It uses the team default API key only; personal API key overrides do not apply.
Updated about 1 month ago