

Conversion Rate Heatmaps
Overview
Conversion Rate Heatmaps allow you to see the clicks on a specific page that were most likely to lead to conversion to a specific action.
Configuration
You can build a Conversion Rate Heatmap within the Metrics tab. Choose the page that you want to see the heatmap for by entering it in the first input box as the URL definition.
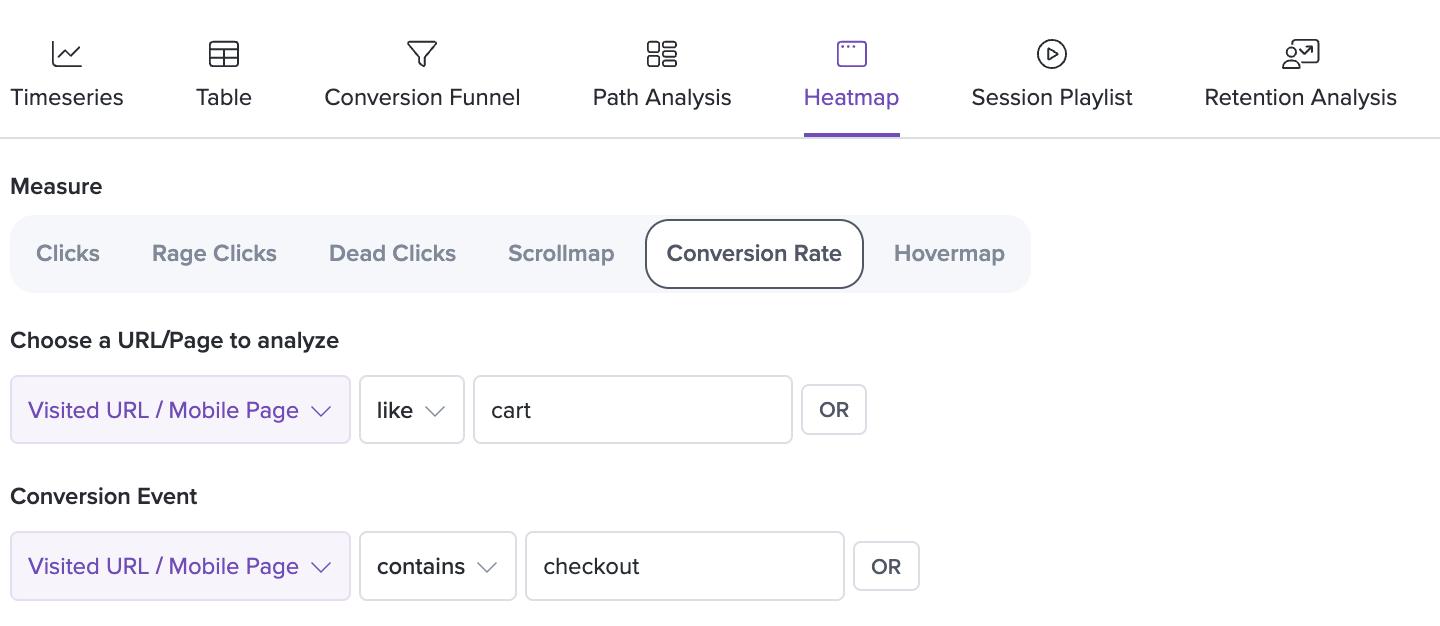
For the conversion event, you can select from Visited URL, Click, and Redux Actions. For example, the above configuration will display a heatmap for the 'cart' page with elements highlighted that had the strongest correlation for users who next visited the 'checkout' page.
Understanding the data
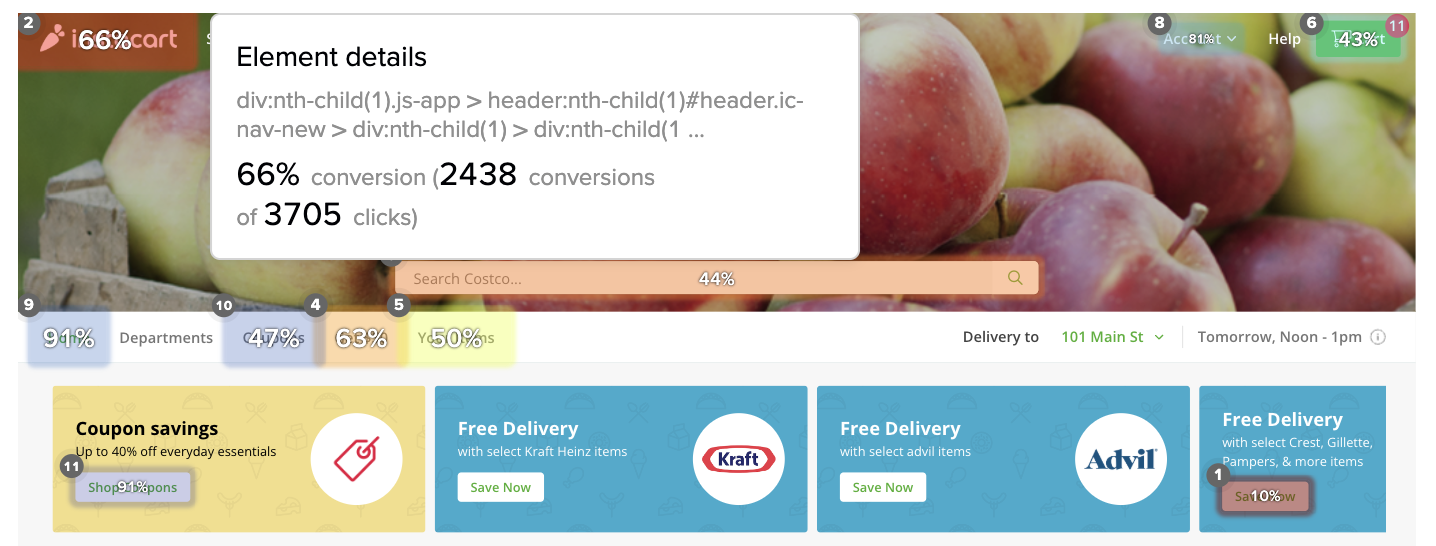
You'll see the most clicked elements for any sessions that completed the specified conversion event highlighted with a color gradient, as well as a percentage overlay. This number tells you the conversion rate for that specific element.
For example, in this image, 24% of clicks on the main landing page text 'Modern Frontend Monitoring and Product Analytics' led to successful completion of the specified conversion event.
The popover shows you detailed metrics on the number of overall clicks on the element as well as the number of conversions.
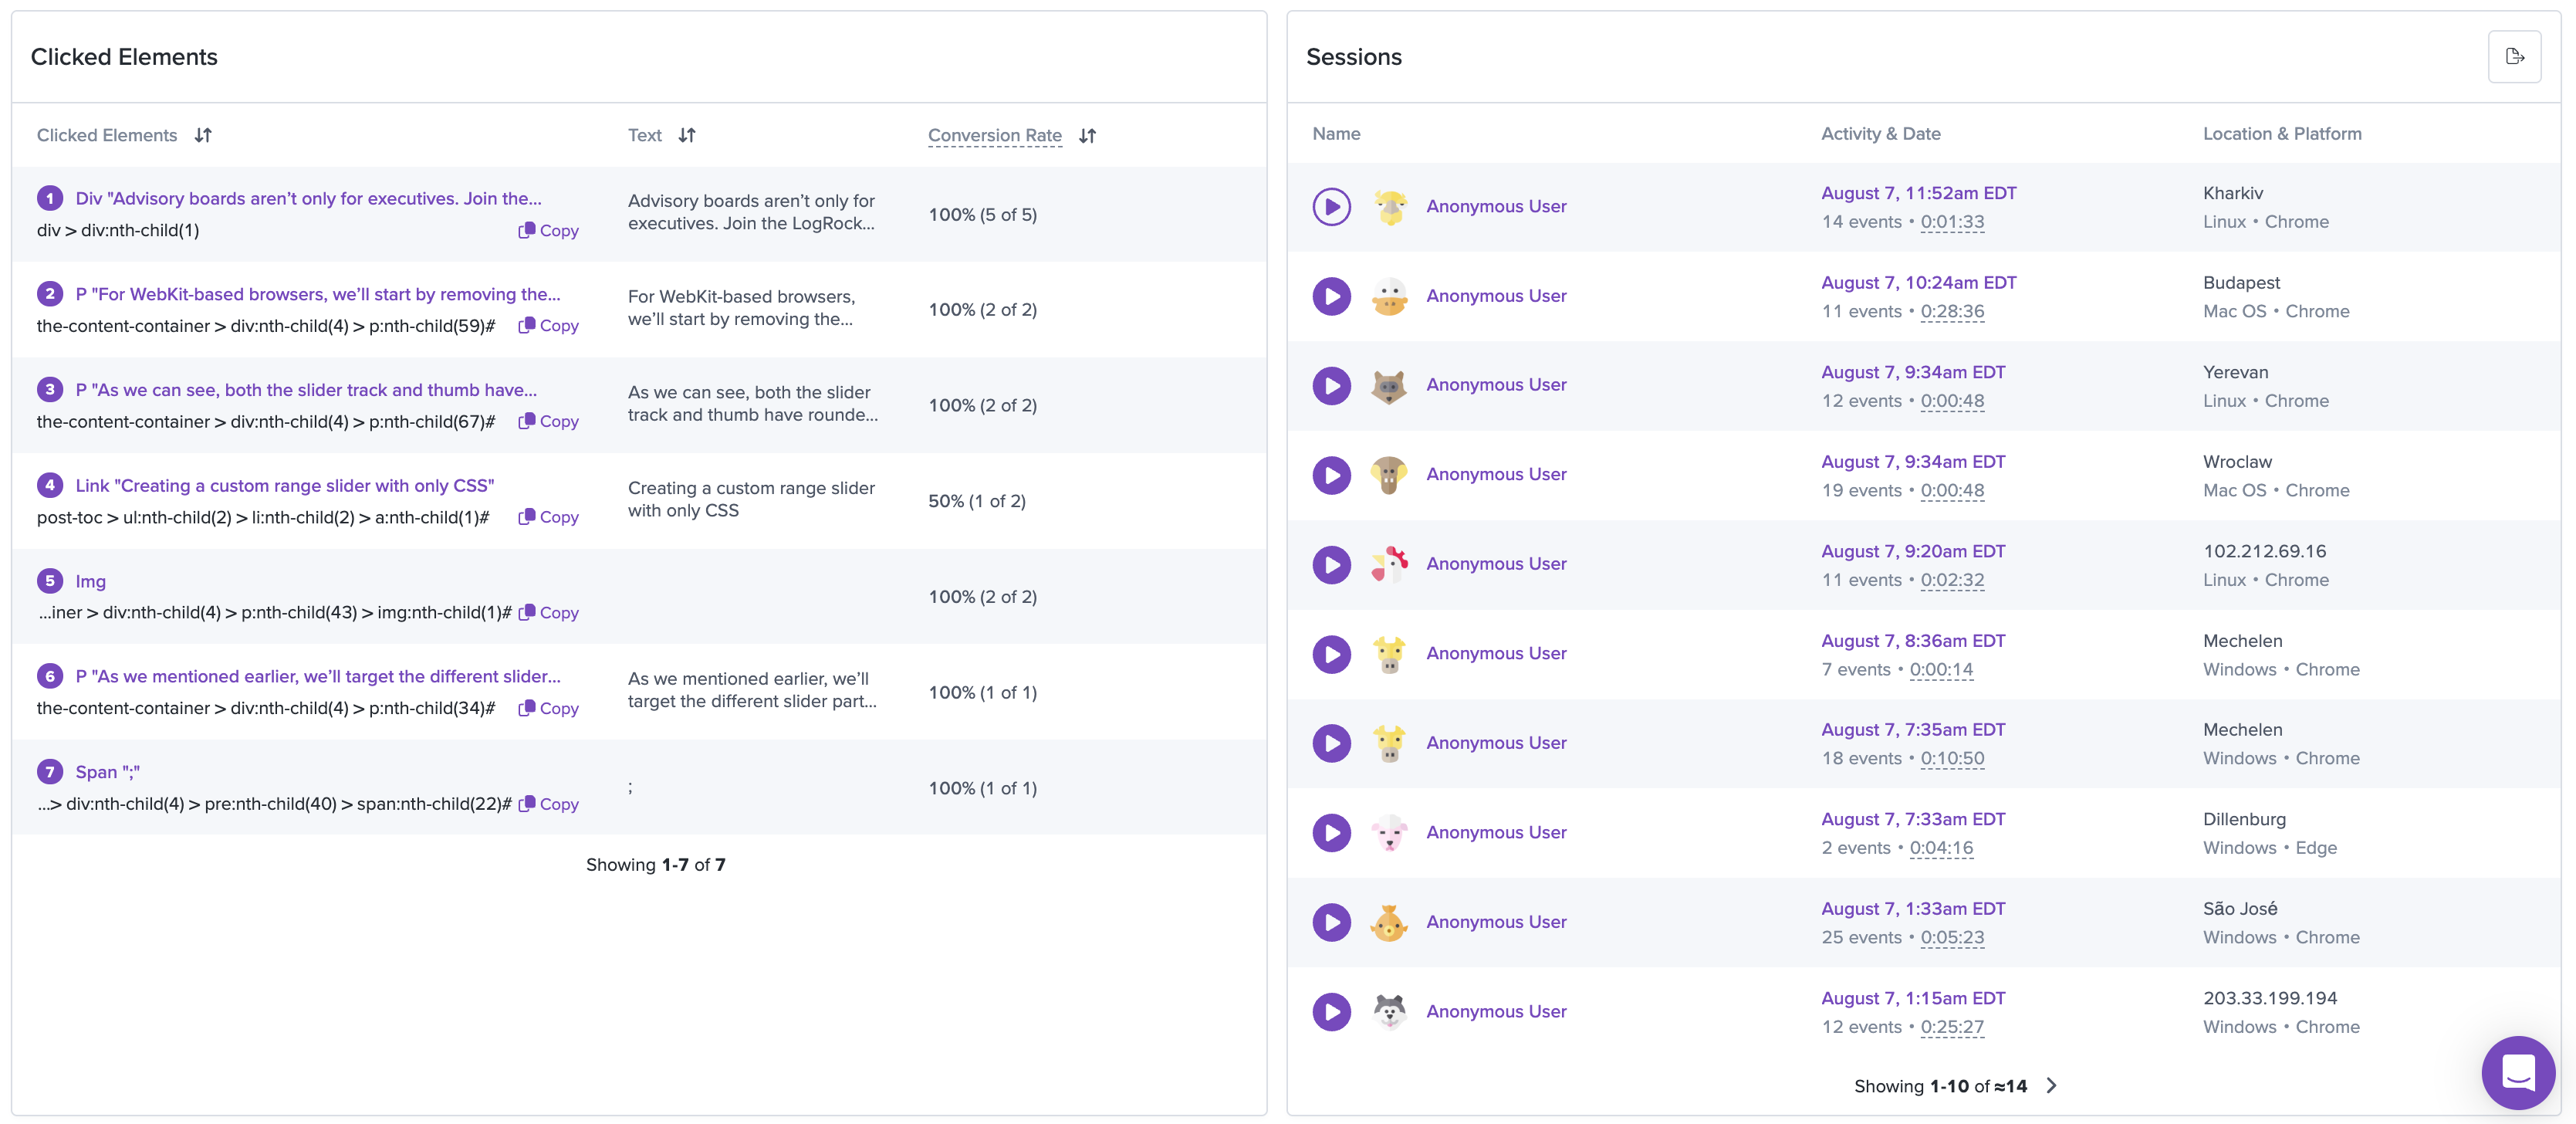
Below the heatmap, you'll see a list of the sessions that have visited the page as well as a list of the most clicked elements.
Updated 11 months ago