
Funnels
Overview
Conversion Funnels help you track the conversion rate between multiple steps or paths within your application. They can give you deep insight into problematic pages or sections where users might be struggling to complete a certain action and dropping out of a flow.
You can track funnel completion for users within a single session or across multiple sessions. You can also specify whether or not users need to have completed the steps in order or whether any order is fine.
Building a funnel
Select "Conversion Funnel" as the Metric Type.
You will see a Funnel Steps section appear below. Here, you can define each step of a flow within your application that you are interested in tracking using the Custom Event, Clicks, Redux Action Type, and Visited URL filter types. You can also use Definitions as funnel steps.
Please note that the 'Element Visible' filter is not currently supported as a funnel step, so you will not see Definitions of that type in the list as an option when creating a funnel.
For example, suppose you are tracking a checkout flow. You might set up the funnel to look something like this:

You can also stack filters on top of the defined steps to refine the insights even further. Suppose that you want to compare the checkout conversion rates for different geographic locations. You can create multiple funnels with the same steps defined (there is a "Copy" feature available) and apply different filters over the same set of steps.
Cross-Session Funnels

You can choose to view funnel conversion completed within a single session ("in a single session" in the dropdown above) or across multiple sessions. For example, if you have a flow that you know users typically complete across multiple days and visits rather than within a single session, it may be more useful for you to track conversion by user across multiple sessions.
If you select the "across multiple sessions" option, you will also see an option to input a time range. This time range allows you to specify what counts as a "successful" conversion for your funnel. If your funnel typically takes 1 hour to complete and you do not want to count any completions longer than 1 hour as a conversion, you can enter that within the boxes.
Group By
You have the option to group your funnel by a specified property. Currently we support grouping single session funnels based on Device, Browser, UTM Medium, UTM Campaign, UTM Source and other properties. Cross-session funnels can be grouped by Initial Visited URL, Initial Referrer, and Initial UTM Campaign. These group bys can help you answer questions like “Was the conversion rate for my funnel lower for users on Mobile devices?” and "Which of my campaigns resulted in the highest conversion rate?". Select a property from the dropdown and you will see different bars representing session volume based on values for each property.
Ordered vs Unordered Funnels
You have the option to create "ordered" or "unordered" funnels. Ordered funnels require the steps in the funnel to be completed in order, whereas unordered funnels allow the steps to be completed in any order, at any point in the session. Ordered funnels can help you answer questions like "How many users purchased an item after viewing the marketing site and adding an item to their cart?" Unordered funnels can help you answer questions like "How many customers visit the blog, view the marketing page, and purchase a new plan in any order?"
Export
You can export the data shown in the funnel to a CSV file. Use the 'Export' option in the top right when viewing the chart. This will export all funnel data and grouped funnel data.
Understanding your funnels
After you create a funnel, there are a few different insights available within the chart.
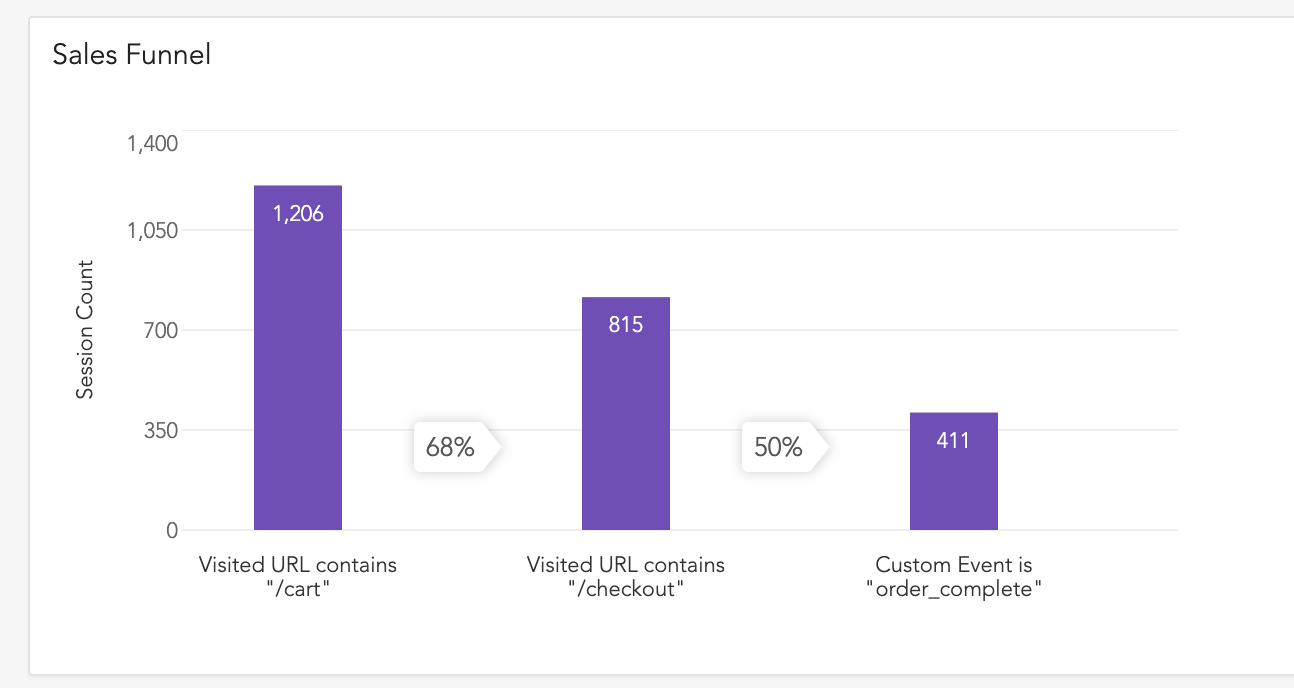
Each bar show the number of sessions that have completed the specified step. The percentages between the bar show the conversion rate between each steps. In the example above, only 8 percent of users who completed the first step also completed the second step.
Below the funnel, you can see a list of sessions associated with it. This can help you get some qualitative insights about the conversion rates.

You can also click on each bar to drill down into the sessions that either did or did not complete each step depending on which insights you are interested in. You may be interested in viewing some of the sessions of users who, for example, did not click the "Buy Now" button but did visit the Checkout page to see if there are any patterns in their behavior. You can also create a Path Analysis chart from any funnel step to learn more about the paths that users may have taken after completing the step.
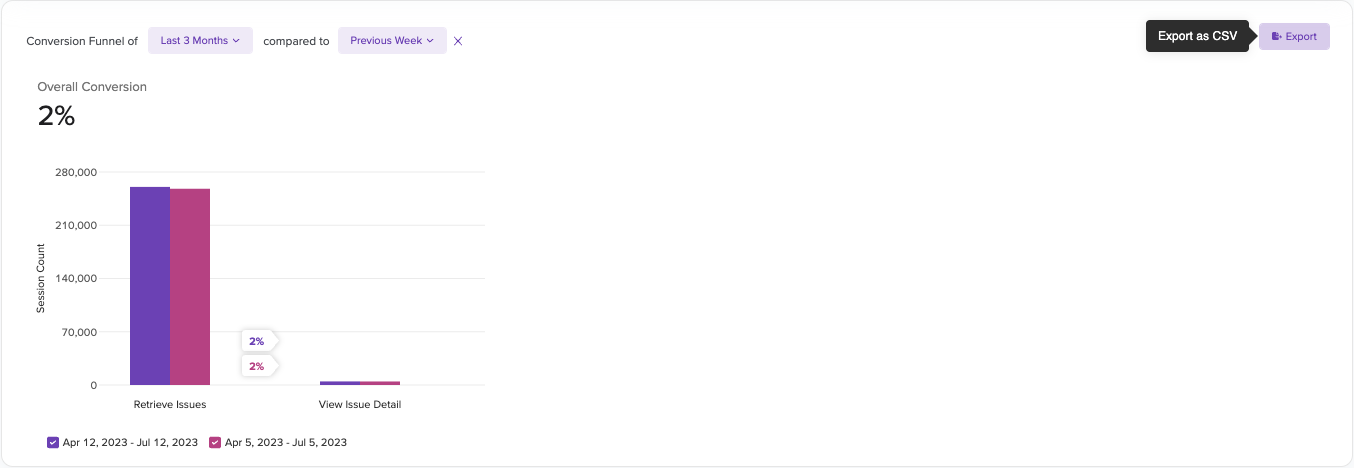
Time Period Comparison

You can also choose to compare a defined funnel for a particular time range to a previous time period. Use the ‘Compare to previous time period’ option in the funnel detail view to compare conversion rates for different time periods within the same chart. You can also click the funnel bars from the previous time period to view associated sessions and insights. Please note that this cannot be used with a Group By property.
Funnel insights
Not all users will complete your funnel. LogRocket can now help you understand why. Using data science, LogRocket automatically surfaces issues that have an impact on completing your funnel. For more, see Metric insights
Revenue in Funnels
You can choose to attach revenue values as part of your funnel. For full details, see here.
Updated 5 months ago