

Session Replay
The Session Replay view shows you a real-time reproduction of your user's session
Helpful Links
A session is a reproduction a users journey through your application. Our SDK records events in your application and these are sent to LogRocket to be processed and reproduced in the Session Replay view.
A session replay is a lot more than just the visual reproduction of your app though, it also includes several powerful analytics features such as Heatmap, Scrollmaps, Performance monitoring, as well as developer features like Network and Console logging and Redux state tracking. You can also use the Inspect Tool to quickly grab important elements in your app to easily create Definitions or Metrics with them.
Overview
The session replay view takes design inspiration from video player UIs, but adapted to fit the variety of analytics features at your disposal.
Time Zones
The date/time shown next to the user avatar (e.g. "4/17/2026, 1:36:09 PM") is displayed in your local timezone — the timezone of your browser. So if that session was recorded by someone in PDT at 10:36 AM, and you're viewing it from EDT, you'd see 1:36 PM.
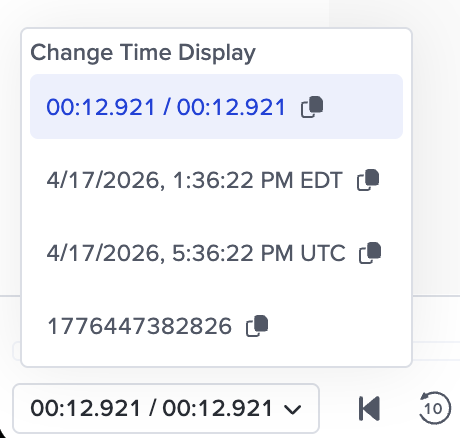
You can change the time displayed in the bottom timebar by clicking on the time in the bottom left.
The options are:
- Relative - Elapsed time within the session (e.g. 01:23 / 15:00)
- Absolute (Local) - Wall-clock time in your timezone (e.g. 4/17/2026, 1:36:09 PM CDT)
- Absolute (UTC) - Wall-clock time in UTC (e.g. 4/17/2026, 6:36:09 PM UTC)
- Unix - Raw Unix timestamp in milliseconds
Navigation UI
At the top of the page on the left we display the current URL (for web sessions) or view name (for mobile sessions) that the user is on at the given time. There is a button that allows you to easily copy this to your clipboard.
Tab UI
At the top of the page, to the right of the Navigation UI, you will find the Tab UI. For sessions with multiple tabs, this will allow you to both see which tab the user is currently active on and switch to viewing only that tab. If there is only one tab, this UI will now show.
If your pages have a document title, the document title will appear here, just as it does in a browser. If none of your pages have a document title, or they are all the same, then tabs are referenced by numbers, with "Tab 1" being the first tab opened in the session.
Viewing all tabs in the session

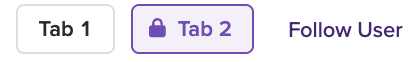
In this example, Tab 1 is currently active
By default, the session replay view is set to "Follow User", which means that LogRocket will always show you the tab that was active at any given point in the session. When the user switches to another tab, you will move with them. The currently active tab's button in the tab UI will be highlighted in purple (or, if it's one of the tabs in the dropdown it will be highlighted in the dropdown list of remaining tabs).
Certain parts of the Session Replay view only display information for one tab, such as the Event Timeline, and they will reload when the user moves to a new tab. When in this mode, you can see purple lines in the Time Bar indicating when tab switches happen.
Viewing one tab only
In this example, we are "locked" to Tab 2
Clicking on a tab button will "lock" to that tab, allowing you to view parts of that tab's session. You can think of tabs as "sub-sessions"—they have their own start and end times (referred to as the "viewport") that correspond to when the tab was opened and closed. So if you want to view something that happened when the user was not active (like an exception or network error) then you can click on that tab in the Tab UI to "lock" to that tab (the tab's button will have a lock icon indicating that you are viewing just that tab).
When you are locked to a tab, the URL updates and you can share the session with your coworkers and they will also only view that tab. To "unlock" and view another tab, simply select another tab to view or click "Follow User".
Using the tab dropdown
If there are more than five tabs then the rest will be available under a dropdown on the right:

Click on the "..." button to view the remaining tabs
If a tab from the dropdown is locked, or if you are following the user and that tab is active, then that tab ID will be displayed in the dropdown button:
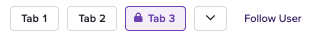
In this example, we are locked to Tab 3
Time Bar
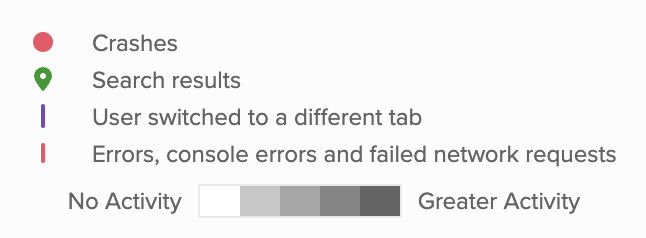
The timebar at the bottom of session replay allows you to to pause, play, and navigate through the session. This displays information about user activity, including clicks, scrolls, and mouse movements. White represents no activity, and dark gray indicates greater user activity. Errors, console errors, and failed network requests are represented with a red line. Tab switches are marked with purple lines.
If you entered session replay from a filtered Session List, the searched for event will be highlighted with a green icon.
Session Controls
On the right side of the footer you can find a number of important features:
- Tools Menu:
- A variety of useful functionality can be accessed from the Tools dropdown, including:
- View DOM
- For web sessions, view the current DOM tree in a form that can be easily examined using your browser's dev tools. From this view, inspect the page as if it were your own browser to view relevant DOM data!
- Crop
- When this is enabled, drag the yellow indicator on the Timebar to set your desired crop duration. You can then share this clip using the Share button or by copying the URL directly. Read more about Cropping here.
- Inspect Mode
- View Inspect Tool docs here.
- Create Heatmap
- Generate a customizable heatmap metric based on the current session timestamp (see heatmap docs here)
- View DOM
- A variety of useful functionality can be accessed from the Tools dropdown, including:
- Live Mode
- If the user is currently active, you can view their live session by entering Live Mode.
- Share
- Share the URL, or share to an Integration such as Jira or GitHub, configured via Settings.
Session Info Panes

The buttons in the top-right corner of the session replay view can be used to toggle various informational displays while watching a session:
Session Info & Events
This pane can be used to view details about the current session or user, as well as the Event Timeline.
User Details:
- User ID
- Session count
- First and last seen dates
- Total time on site (across all recorded sessions for this user)
- User traits from the current session (one section for each trait with label, read about identifying users for Web, iOS, Android, and React Native)
Session details:
- IP Address
- Browser or device info (depending on session device type)
- Browser specific information (e.g. browser name, referrer, user agent, language)
- Release
- SDK version
- Performance information (e.g. time to first byte)
Event Timeline
A list of events that happen in the session replay. Filter events by name and use a multi-select to change which event types are listed.
Clicking on an event timeline entry’s header will expand the entry. This will show more details like the custom event details or the URL of the navigation event. This also allows the user to “View Similar Sessions”, which links to the session list filtering for that event.
Clicking on an event timeline entry will set the current Video Time to that event’s time. It will also expand the entry.
When the Video Time changes, the event timeline’s scroll container will scroll to center around the event nearest to the Video Time (indicated by a bold title).
If coming from a filtered session list, events matching your filters will have a green dot indicator for the event icon.
The event timeline currently only shows events for the current tab the user is on in the replay.
Network & Performance
Network
A table of network entries and a timeline UI on the right visually indicating their start and end time in the current Viewport Range.
This includes the Network Timeline - a timeline UI that shows the network entries in a sortable list with horizontal bars indicating the start and end time of the network request, colored by the network status code.
Select a network entry to view more information. This opens a pane on the right displaying the following:
- Request URL, method, status, and duration
- Trace URL from integrations (if integrated)
- Request headers and body (if any)
- Response headers and body (if any)
Search for a network entry using the search bar at the top of the Network pane. By default, the field will search for matching strings within the URLs of network requests and responses. Additional fields can be searched by specifying method, status, and graphql. The search bar supports =, =!, >, <, >=, <=, and : as operators (where =! means not equal and : means contains). For example, searching method!=GET will filter out any GET requests, while status=0will show requests that failed to send.
Performance
The performance timeline shows a timeline UI with different charts showing performance information. See more details here.
Logs
Log Entry Types
- Logs - Standard log events sent by the SDK, either by the platform-specific logging or LogRocket.log. In the browser, these are console.log events
- Warnings - Logs labelled as warnings. These are often sent by third-party scripts
- Errors - These include exceptions (caught by LogRocket or manually reported by LogRocket.captureException) as well as error logs (e.g. console.error)
- When expanded, any relevant stack trace is shown
- Info - Logs labelled as info
- Debug - Logs labelled as debug.
- Redux - Redux action logs. These include the redux state before and after the action, the action payload, and the difference in state before and after. You can also copy the state before and after and the action payload
- Navigation - Navigation events, which include normal browser navigation (like to a new page in a multi-page application) as well as history navigation (e.g. query param changes, single-page application URL changes)
Updated 3 months ago