

Survey Analytics
Every survey in LogRocket has its own analytics dashboard. You can see how it's performing at a glance, dig into question-level breakdowns, search individual responses by keyword, and jump straight into the session replay for any submission.
Click any survey name from the Surveys list to open its dashboard.
Dashboard layout
The survey dashboard is a single scrollable page with three sections: Summary, Question breakdown, and Individual responses. Use the tabs at the top to jump to each section — they're anchor links, not separate views, so you never lose context while exploring the data.
Summary
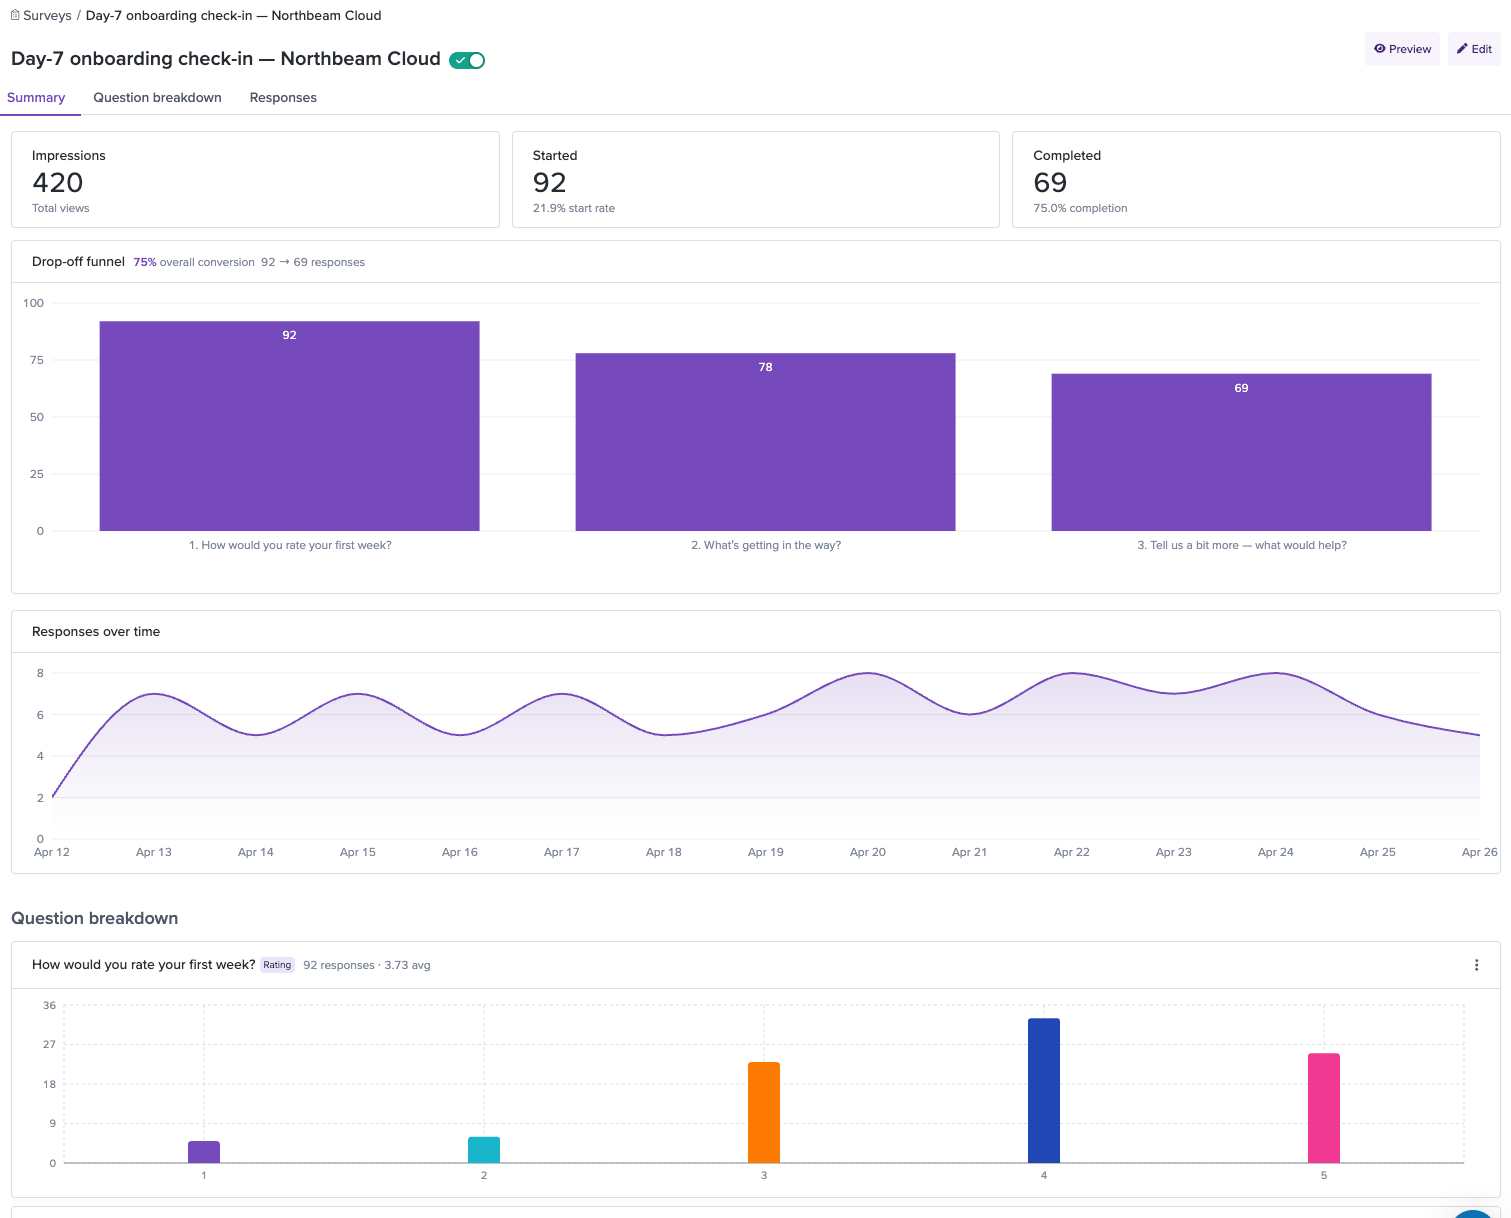
The Summary section shows whether your survey is working.
Headline metrics
Three cards at the top show:
- Impressions — The count of sessions in which the survey widget was shown to users.
- Started — Number of users who opened the survey and submitted at least one response, with the start rate as a percentage of impressions.
- Completed — Number of users who submitted all required questions and viewed the survey to the end, with the completion rate as a percentage of started.
Drop-off funnel
Below the headline metrics, a step-by-step funnel visualization shows how many respondents made it through each question in your survey. Each bar displays the absolute count and the percentage of original respondents who reached that step. Between each pair of steps, the conversion rate tells you what percentage continued to the next question.
The drop-off funnel is a diagnostic tool. A sharp drop between two steps means that question is causing people to bail. Common culprits: questions that feel too personal, open text fields that ask too much effort too early, or questions that don't feel relevant. When you spot a steep drop-off, consider rewording the question, making it conditional so it only appears to the right audience, or moving it later in the flow. See [[Survey Best Practices]] for more guidance.
Responses over time
A line chart shows the volume of completed responses over time. Use it to spot trends — a spike after a product launch, a gradual decline as your user segment cycles through the survey, or a sustained plateau that tells you the targeting is reaching a steady state.
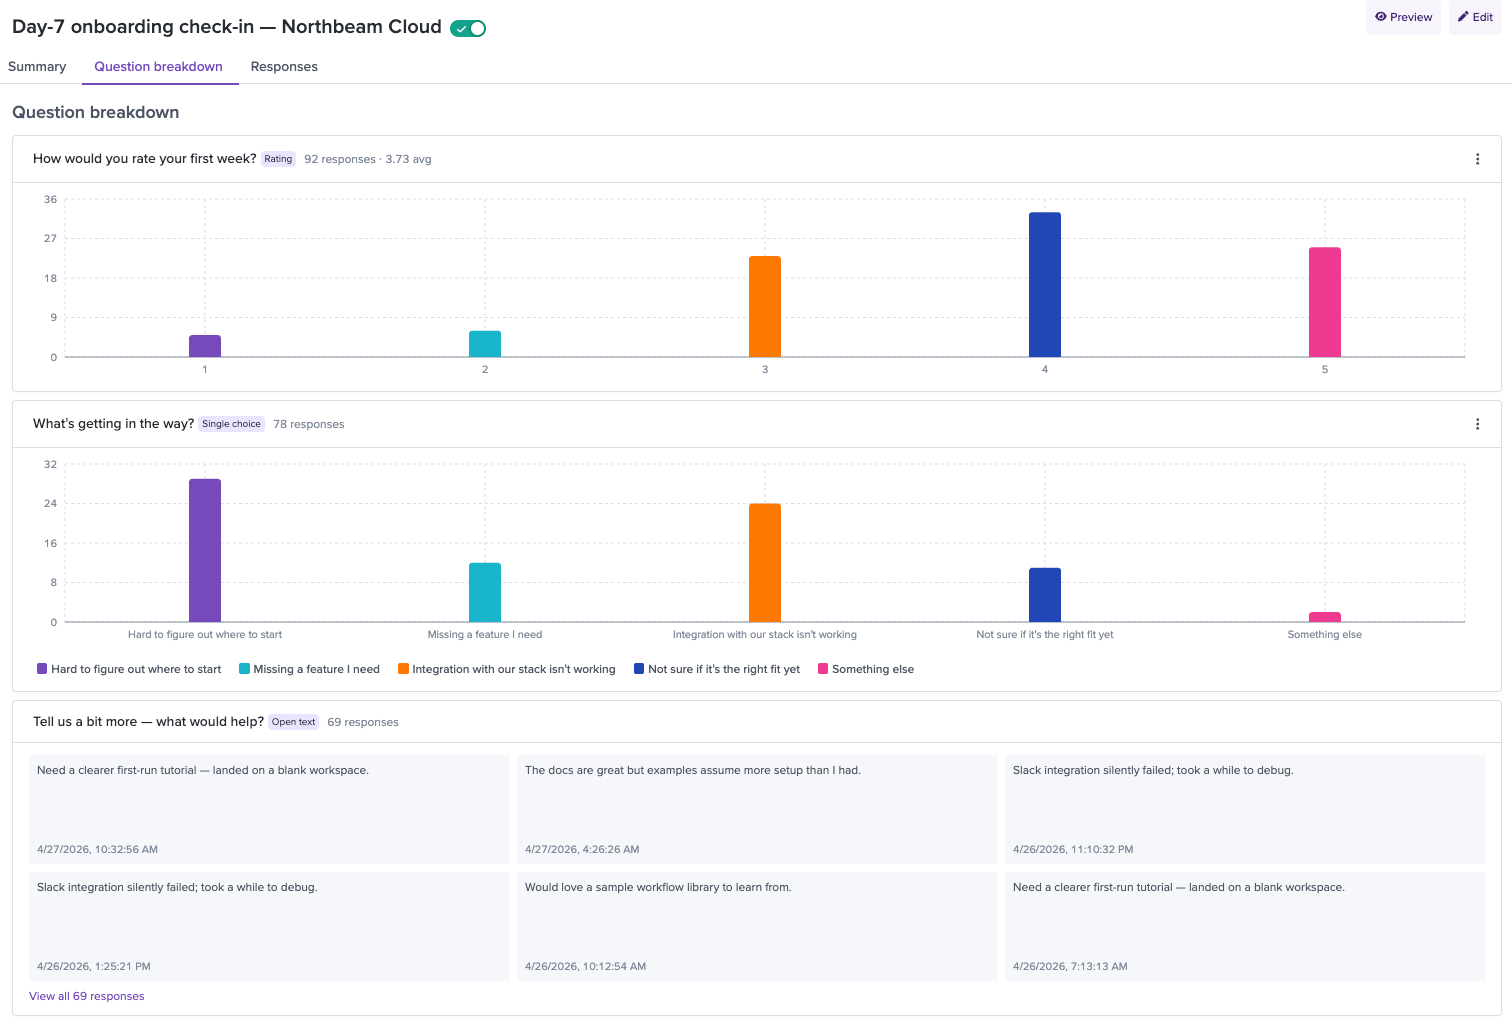
Question breakdown
The Question breakdown section shows how people answered each question. Each question type gets a chart tailored to its data.
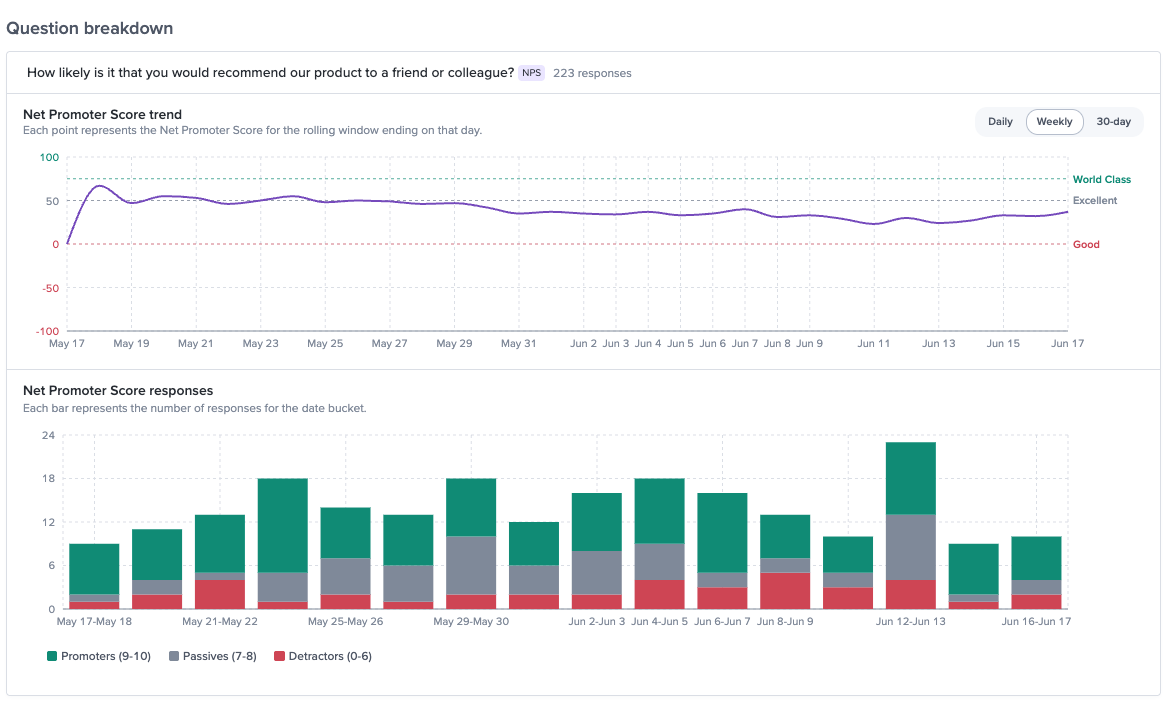
Trending NPS scores and responses over time
Rating questions — A histogram showing the count of responses at each value on the scale, with the average rating displayed.
NPS questions — A line chart of the average NPS score overtime and a bar chart showing the breakdown of Detractors (0-6), Passives (7-8), and Promoters (9-10).
Single choice questions — A horizontal bar chart showing the count for each answer option, so you can see which option dominated.
Multiple choice questions — A bar chart showing how many respondents selected each option. Since respondents can pick multiple answers, the total count across options may exceed the number of respondents.
Ranking questions — A visualization showing the average rank for each item, so you can see which items respondents consistently placed higher.
Individual responses
The Individual responses table shows every single submission — who responded, what they said, and a direct link to their session.
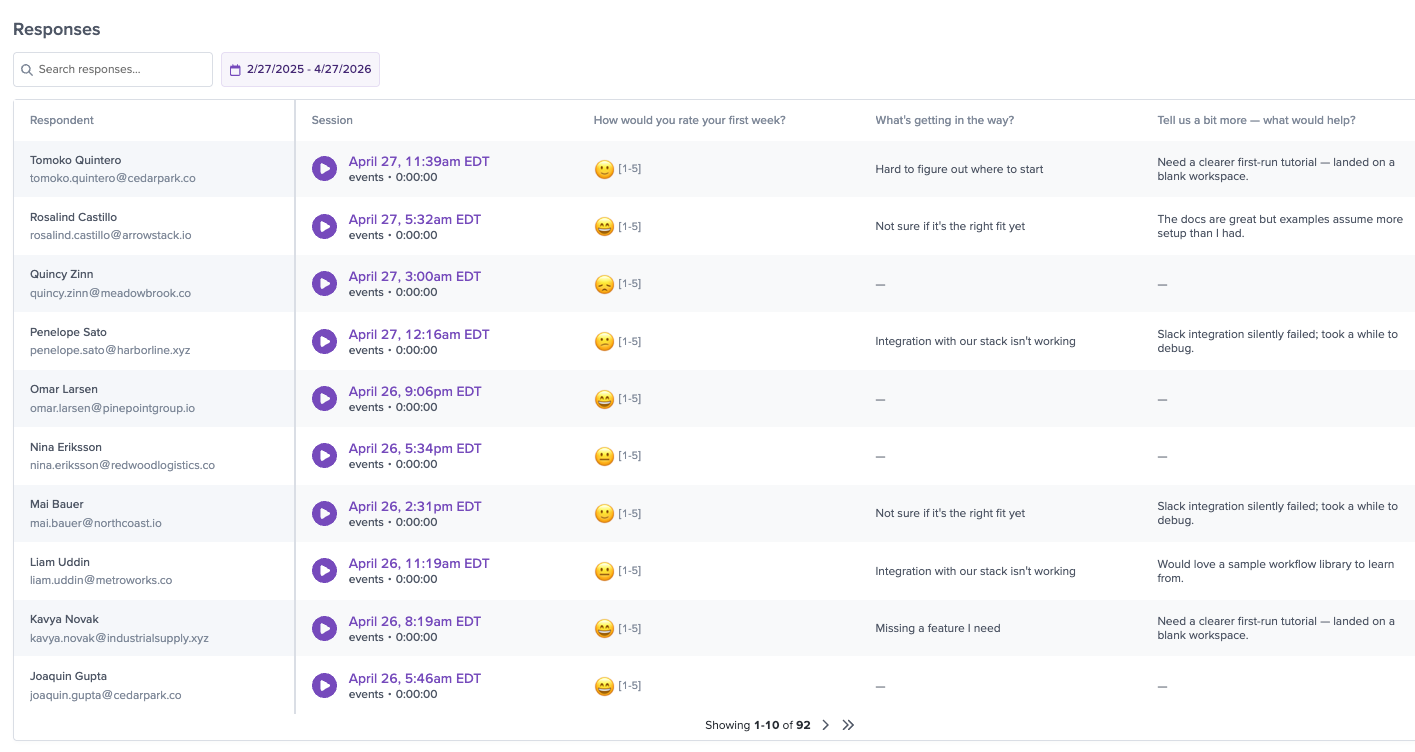
Table columns
- Respondent — The user's name and email (or anonymous user ID if not identified). Displayed with an avatar.
- Session — A play button that links directly to the session replay where the response was submitted.
- Rating — The user's star rating (if the survey includes a rating question). Shown as star icons.
- Per-question columns — One column for each question in the survey, showing the respondent's answer.
- Date — When the response was submitted.
Searching responses
The search bar at the top of the table performs a full-text search across all text responses for the survey. Type at least 3 characters and results filter in real time. This is useful for finding specific keywords or themes — for example, searching "slow" to find every response that mentions performance, or "SDK" to surface developer experience feedback.
Filtering by date
Use the Date range dropdown to narrow responses to a specific time period. This is helpful for isolating responses from before or after a product change, or for comparing different time windows.
Exporting responses
Click Export CSV in the top-right corner of the table to download all responses (or the currently filtered set) as a CSV file. The export includes all columns visible in the table — respondent, session link, answers, and date.
Session replay: the full picture behind every response
The session replay link on each individual response is what makes LogRocket Surveys fundamentally different from standalone survey tools.
Here's a real scenario: A user completes your onboarding survey and rates the experience 1 star. They write "nothing worked" in the open text field. With a standalone survey tool, that's all you have — a score and a vague comment. You'd need to follow up, ask questions, and hope the user remembers what happened.
With LogRocket, you click the play button next to their response. You see them land on your getting-started page, click the "Install SDK" button, get a 404 error on the docs link, try two more times, give up, navigate back, attempt the alternative setup flow, hit a JavaScript error on the config page, and finally close the tab. In two minutes of watching, you've identified two bugs — a broken docs link and a JavaScript error — that explain the frustration better than any follow-up email ever could.
That's the difference: survey data tells you what users feel. Session replay tells you why. Together, they turn feedback into action.
Turning insights into action
The data is only useful if it leads to action. Here's how to close the loop.
Create saved searches from survey signals
Use the Survey Response filter to build saved session searches based on survey data. For example, create a saved search for "all sessions with NPS 0–6" and review Detractor sessions weekly as a team ritual. Or build a search for "all sessions where the user selected 'Missing features I need'" on your exit survey to surface exactly what's missing.
Track impact over time
After shipping a product change aimed at fixing a survey-identified issue, use the Survey Response timeseries to see whether the metric actually moves. For example, if users complained about onboarding difficulty and you shipped a guided setup wizard, track whether average onboarding satisfaction ratings improve in the weeks that follow.
Share with your team
Export responses as CSV for teammates who don't have LogRocket access, or share session replay links directly in Slack, Linear, or whatever issue tracker you use. A replay link on a bug report beats a paragraph of repro steps every time.
Updated about 1 month ago